
|
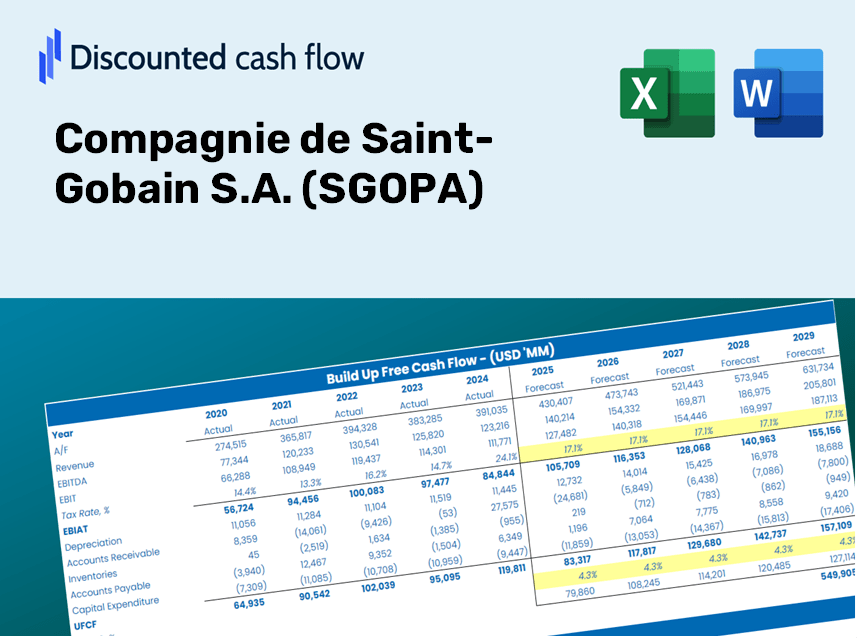
Compagnie de Saint-Gobain S.A. (SGO.PA) DCF-Bewertung |
Fully Editable: Tailor To Your Needs In Excel Or Sheets
Professional Design: Trusted, Industry-Standard Templates
Investor-Approved Valuation Models
MAC/PC Compatible, Fully Unlocked
No Expertise Is Needed; Easy To Follow
Compagnie de Saint-Gobain S.A. (SGO.PA) Bundle
Stürzen Sie Ihre Analyse und steigern Sie die Präzision mit unserem [SGOPA] DCF -Taschenrechner! Durch die Verwendung realer Daten von Compagnie de Saint-Gobain S.A. und die Ermöglichung anpassbarer Annahmen ermöglichen dieses Tool Sie, wie ein erfahrener Investor prognostiziert, analysieren und Wert [Unternehmen].
What You Will Receive
- Customizable Excel Template: A fully adjustable Excel-based DCF Calculator featuring pre-filled financial data for Compagnie de Saint-Gobain S.A. (SGOPA).
- Current Market Data: Historical figures along with projected estimates (visible in the highlighted cells).
- Flexible Forecasting: Modify forecast assumptions such as revenue growth, EBITDA margin, and WACC.
- Instant Calculations: Quickly observe how your inputs affect the valuation of Compagnie de Saint-Gobain S.A. (SGOPA).
- Professional Resource: Designed for investors, CFOs, consultants, and financial analysts.
- Intuitive Layout: Organized for clarity and user-friendliness, complete with step-by-step guidance.
Key Features
- Pre-Loaded Data: Historical financial statements and pre-filled forecasts for Compagnie de Saint-Gobain S.A. (SGOPA).
- Fully Adjustable Inputs: Customize WACC, tax rates, revenue growth, and EBITDA margins according to your analysis.
- Instant Results: Witness the recalculation of Compagnie de Saint-Gobain's intrinsic value in real time.
- Clear Visual Outputs: Dashboard charts provide insights into valuation results and essential metrics.
- Built for Accuracy: A professional-grade tool tailored for analysts, investors, and finance professionals.
How It Functions
- Download the Template: Gain immediate access to the Excel-based SGOPA DCF Calculator.
- Input Your Assumptions: Modify the yellow-highlighted cells for growth rates, WACC, margins, and other parameters.
- Instant Calculations: The model automatically recalculates Saint-Gobain’s intrinsic value.
- Test Scenarios: Experiment with various assumptions to assess potential changes in valuation.
- Analyze and Decide: Leverage the outcomes to inform your investment or financial analysis.
Why Opt for This Calculator?
- Designed for Experts: A sophisticated tool favored by analysts, CFOs, and industry consultants.
- Accurate Financial Data: Historical and projected financials for Compagnie de Saint-Gobain S.A. (SGOPA) are preloaded for precision.
- Flexible Scenario Analysis: Easily model various forecasts and assumptions.
- Comprehensive Outputs: Automatically computes intrinsic value, NPV, and essential metrics.
- User-Friendly: Step-by-step guidance helps navigate every aspect of the calculator.
Who Should Use This Product?
- Investors: Evaluate the valuation of Compagnie de Saint-Gobain (SGOPA) prior to making stock transactions.
- CFOs and Financial Analysts: Optimize valuation methodologies and validate financial projections.
- Startup Founders: Discover how large public corporations like Compagnie de Saint-Gobain (SGOPA) are assessed financially.
- Consultants: Provide comprehensive valuation reports for stakeholders.
- Students and Educators: Utilize actual data for practicing and teaching valuation strategies.
Contents of the Template
- Preloaded SGOPA Data: Historical and projected financial information, including revenue, EBIT, and capital expenditures.
- DCF and WACC Models: Professional-grade spreadsheets designed for calculating intrinsic value and Weighted Average Cost of Capital.
- Editable Inputs: Yellow-highlighted cells for modifying revenue growth, tax rates, and discount rates.
- Financial Statements: Detailed annual and quarterly financial data for thorough analysis.
- Key Ratios: Metrics on profitability, leverage, and efficiency to assess performance.
- Dashboard and Charts: Visual representations of valuation results and underlying assumptions.
Disclaimer
All information, articles, and product details provided on this website are for general informational and educational purposes only. We do not claim any ownership over, nor do we intend to infringe upon, any trademarks, copyrights, logos, brand names, or other intellectual property mentioned or depicted on this site. Such intellectual property remains the property of its respective owners, and any references here are made solely for identification or informational purposes, without implying any affiliation, endorsement, or partnership.
We make no representations or warranties, express or implied, regarding the accuracy, completeness, or suitability of any content or products presented. Nothing on this website should be construed as legal, tax, investment, financial, medical, or other professional advice. In addition, no part of this site—including articles or product references—constitutes a solicitation, recommendation, endorsement, advertisement, or offer to buy or sell any securities, franchises, or other financial instruments, particularly in jurisdictions where such activity would be unlawful.
All content is of a general nature and may not address the specific circumstances of any individual or entity. It is not a substitute for professional advice or services. Any actions you take based on the information provided here are strictly at your own risk. You accept full responsibility for any decisions or outcomes arising from your use of this website and agree to release us from any liability in connection with your use of, or reliance upon, the content or products found herein.