
|
Spar Group, Inc. (SGRP) DCF -Bewertung |
Fully Editable: Tailor To Your Needs In Excel Or Sheets
Professional Design: Trusted, Industry-Standard Templates
Investor-Approved Valuation Models
MAC/PC Compatible, Fully Unlocked
No Expertise Is Needed; Easy To Follow
SPAR Group, Inc. (SGRP) Bundle
Optimieren Sie Ihre Zeit und verbessern Sie die Präzision mit unserem (SGRP) DCF -Taschenrechner! Mit den Daten und anpassbaren Parametern von SPAR Group, Inc. können Sie wie ein erfahrener Investor die Prognose, Analyse und Value SPAR Group, Inc. erhalten.
What You Will Get
- Real SGRP Financial Data: Pre-filled with SPAR Group, Inc.'s historical and projected data for precise analysis.
- Fully Editable Template: Easily modify key inputs such as revenue growth, WACC, and EBITDA %.
- Automatic Calculations: Watch SGRP's intrinsic value update in real-time based on your adjustments.
- Professional Valuation Tool: Tailored for investors, analysts, and consultants seeking reliable DCF results.
- User-Friendly Design: Intuitive layout and straightforward instructions for users of all experience levels.
Key Features
- Customizable Financial Inputs: Adjust essential metrics such as sales growth, profit margins, and investment levels.
- Instant DCF Valuation: Quickly computes intrinsic value, net present value (NPV), and additional financial metrics.
- High-Precision Accuracy: Leverages SPAR Group's actual financial data for credible valuation results.
- Streamlined Scenario Analysis: Easily evaluate various assumptions and analyze results side by side.
- Efficiency Booster: Avoid the hassle of constructing intricate valuation models from the ground up.
How It Works
- Step 1: Download the prebuilt Excel template with SPAR Group, Inc.'s (SGRP) data included.
- Step 2: Explore the pre-filled sheets and familiarize yourself with the key metrics.
- Step 3: Update forecasts and assumptions in the editable yellow cells (WACC, growth, margins).
- Step 4: Instantly view recalculated results, including SPAR Group, Inc.'s (SGRP) intrinsic value.
- Step 5: Make informed investment decisions or generate reports using the outputs.
Why Choose SPAR Group, Inc. (SGRP) Calculator?
- Accuracy: Utilizes real SPAR Group financials for precise data representation.
- Flexibility: Tailored for users to easily adjust and experiment with inputs.
- Time-Saving: Eliminate the need to construct a DCF model from the ground up.
- Professional-Grade: Crafted with the expertise and usability expected at the CFO level.
- User-Friendly: Simple interface designed for users of all financial backgrounds.
Who Should Use This Product?
- Investors: Evaluate SPAR Group, Inc.'s (SGRP) performance before making investment decisions.
- CFOs and Financial Analysts: Enhance financial assessments and refine growth forecasts for SPAR Group, Inc. (SGRP).
- Startup Founders: Understand the valuation methods applied to companies like SPAR Group, Inc. (SGRP).
- Consultants: Create detailed valuation reports for clients involving SPAR Group, Inc. (SGRP).
- Students and Educators: Utilize SPAR Group, Inc. (SGRP) data to practice and instruct on valuation strategies.
What the Template Contains
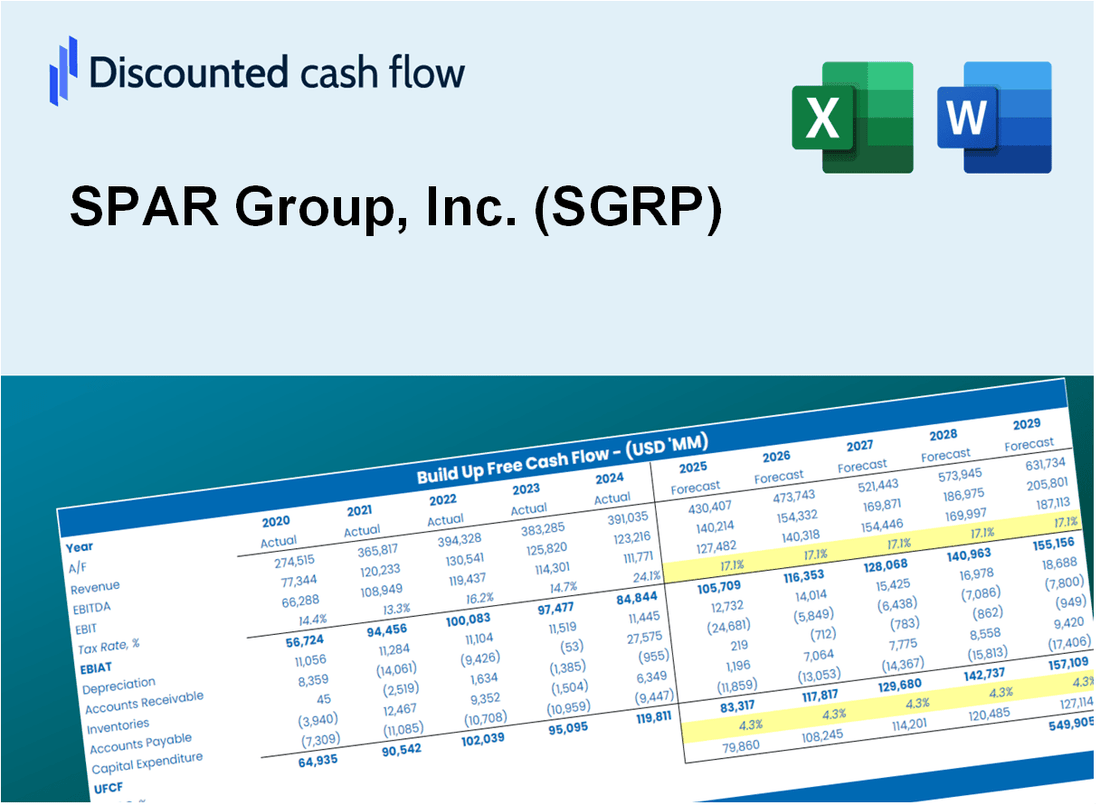
- Preloaded SGRP Data: Historical and projected financial data, including revenue, EBIT, and capital expenditures.
- DCF and WACC Models: Professional-grade sheets for calculating intrinsic value and Weighted Average Cost of Capital.
- Editable Inputs: Yellow-highlighted cells for adjusting revenue growth, tax rates, and discount rates.
- Financial Statements: Comprehensive annual and quarterly financials for deeper analysis.
- Key Ratios: Profitability, leverage, and efficiency ratios to evaluate performance.
- Dashboard and Charts: Visual summaries of valuation outcomes and assumptions.
Disclaimer
All information, articles, and product details provided on this website are for general informational and educational purposes only. We do not claim any ownership over, nor do we intend to infringe upon, any trademarks, copyrights, logos, brand names, or other intellectual property mentioned or depicted on this site. Such intellectual property remains the property of its respective owners, and any references here are made solely for identification or informational purposes, without implying any affiliation, endorsement, or partnership.
We make no representations or warranties, express or implied, regarding the accuracy, completeness, or suitability of any content or products presented. Nothing on this website should be construed as legal, tax, investment, financial, medical, or other professional advice. In addition, no part of this site—including articles or product references—constitutes a solicitation, recommendation, endorsement, advertisement, or offer to buy or sell any securities, franchises, or other financial instruments, particularly in jurisdictions where such activity would be unlawful.
All content is of a general nature and may not address the specific circumstances of any individual or entity. It is not a substitute for professional advice or services. Any actions you take based on the information provided here are strictly at your own risk. You accept full responsibility for any decisions or outcomes arising from your use of this website and agree to release us from any liability in connection with your use of, or reliance upon, the content or products found herein.