
|
Shoals Technologies Group, Inc. (SHLS) DCF -Bewertung |
Fully Editable: Tailor To Your Needs In Excel Or Sheets
Professional Design: Trusted, Industry-Standard Templates
Investor-Approved Valuation Models
MAC/PC Compatible, Fully Unlocked
No Expertise Is Needed; Easy To Follow
Shoals Technologies Group, Inc. (SHLS) Bundle
Unser (SHLS) DCF-Taschenrechner (SHLS) für Genauigkeit entwickelt, ermöglicht es Sie, die Bewertung der Shoals Technologies Group, Inc. unter Verwendung von Finanzdaten in Echtzeit und der vollständigen Flexibilität zu bewerten, um alle wesentlichen Parameter für verbesserte Projektionen zu ändern.
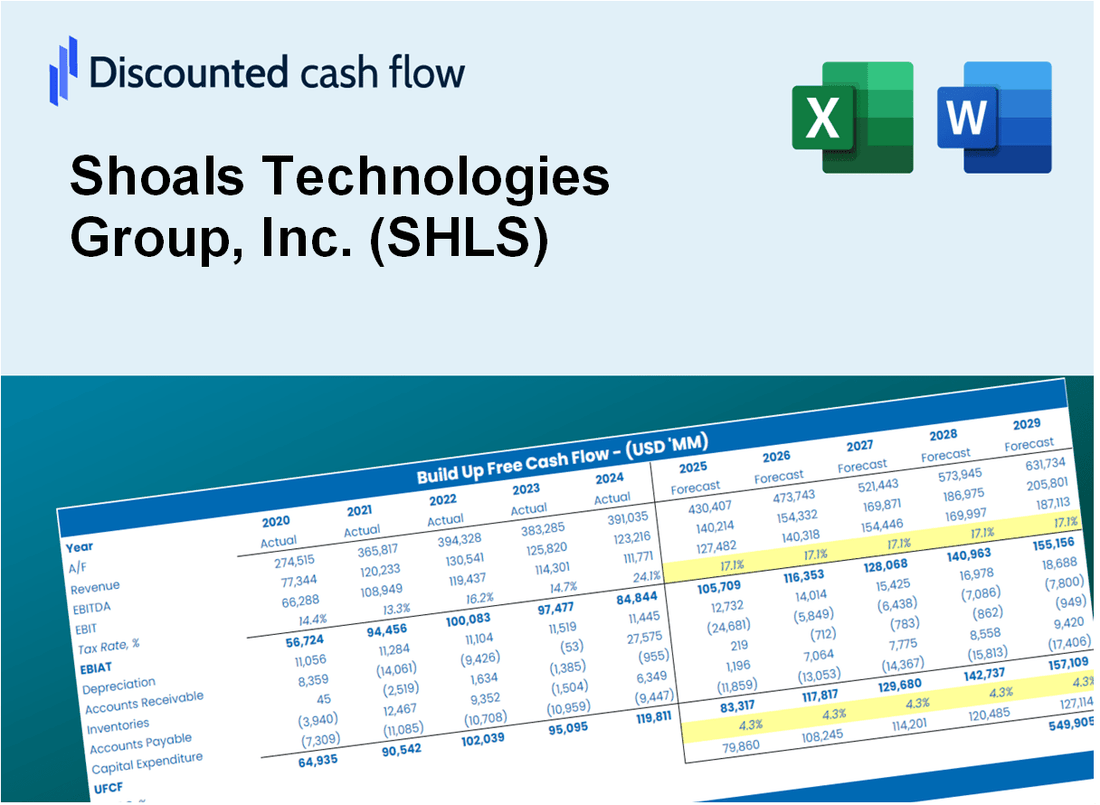
Discounted Cash Flow (DCF) - (USD MM)
| Year | AY1 2020 |
AY2 2021 |
AY3 2022 |
AY4 2023 |
AY5 2024 |
FY1 2025 |
FY2 2026 |
FY3 2027 |
FY4 2028 |
FY5 2029 |
|---|---|---|---|---|---|---|---|---|---|---|
| Revenue | 175.5 | 213.2 | 326.9 | 488.9 | 399.2 | 505.0 | 638.9 | 808.2 | 1,022.4 | 1,293.3 |
| Revenue Growth, % | 0 | 21.48 | 53.34 | 49.55 | -18.35 | 26.5 | 26.5 | 26.5 | 26.5 | 26.5 |
| EBITDA | 46.7 | 28.6 | 181.0 | 89.6 | 64.3 | 131.1 | 165.9 | 209.9 | 265.5 | 335.8 |
| EBITDA, % | 26.6 | 13.43 | 55.38 | 18.32 | 16.11 | 25.97 | 25.97 | 25.97 | 25.97 | 25.97 |
| Depreciation | 9.4 | 10.1 | 10.5 | 10.5 | 12.6 | 18.8 | 23.8 | 30.1 | 38.0 | 48.1 |
| Depreciation, % | 5.36 | 4.72 | 3.21 | 2.15 | 3.16 | 3.72 | 3.72 | 3.72 | 3.72 | 3.72 |
| EBIT | 37.3 | 18.6 | 170.5 | 79.0 | 51.7 | 112.3 | 142.1 | 179.8 | 227.4 | 287.7 |
| EBIT, % | 21.24 | 8.71 | 52.16 | 16.16 | 12.95 | 22.25 | 22.25 | 22.25 | 22.25 | 22.25 |
| Total Cash | 10.1 | 5.0 | 8.8 | 22.7 | 23.5 | 21.5 | 27.2 | 34.4 | 43.6 | 55.1 |
| Total Cash, percent | .0 | .0 | .0 | .0 | .0 | .0 | .0 | .0 | .0 | .0 |
| Account Receivables | 30.8 | 45.0 | 67.3 | 147.3 | 99.0 | 115.3 | 145.9 | 184.5 | 233.4 | 295.3 |
| Account Receivables, % | 17.55 | 21.12 | 20.58 | 30.12 | 24.8 | 22.83 | 22.83 | 22.83 | 22.83 | 22.83 |
| Inventories | 15.1 | 38.4 | 72.9 | 52.8 | 56.0 | 74.5 | 94.2 | 119.2 | 150.7 | 190.7 |
| Inventories, % | 8.62 | 18 | 22.28 | 10.8 | 14.02 | 14.74 | 14.74 | 14.74 | 14.74 | 14.74 |
| Accounts Payable | 14.6 | 20.0 | 9.5 | 14.4 | 20.0 | 28.9 | 36.5 | 46.2 | 58.4 | 73.9 |
| Accounts Payable, % | 8.34 | 9.37 | 2.9 | 2.94 | 5.02 | 5.71 | 5.71 | 5.71 | 5.71 | 5.71 |
| Capital Expenditure | -3.2 | -4.1 | -3.2 | -10.6 | -8.4 | -9.1 | -11.5 | -14.6 | -18.4 | -23.3 |
| Capital Expenditure, % | -1.84 | -1.94 | -0.9647 | -2.16 | -2.1 | -1.8 | -1.8 | -1.8 | -1.8 | -1.8 |
| Tax Rate, % | 36.28 | 36.28 | 36.28 | 36.28 | 36.28 | 36.28 | 36.28 | 36.28 | 36.28 | 36.28 |
| EBITAT | 37.3 | 10.8 | 143.2 | 57.5 | 32.9 | 85.1 | 107.6 | 136.2 | 172.3 | 217.9 |
| Depreciation | ||||||||||
| Changes in Account Receivables | ||||||||||
| Changes in Inventories | ||||||||||
| Changes in Accounts Payable | ||||||||||
| Capital Expenditure | ||||||||||
| UFCF | 12.2 | -15.4 | 83.3 | 2.5 | 87.9 | 68.8 | 77.3 | 97.7 | 123.6 | 156.4 |
| WACC, % | 11.52 | 11.15 | 11.38 | 11.28 | 11.2 | 11.3 | 11.3 | 11.3 | 11.3 | 11.3 |
| PV UFCF | ||||||||||
| SUM PV UFCF | 367.2 | |||||||||
| Long Term Growth Rate, % | 4.00 | |||||||||
| Free cash flow (T + 1) | 163 | |||||||||
| Terminal Value | 2,227 | |||||||||
| Present Terminal Value | 1,304 | |||||||||
| Enterprise Value | 1,671 | |||||||||
| Net Debt | 120 | |||||||||
| Equity Value | 1,551 | |||||||||
| Diluted Shares Outstanding, MM | 169 | |||||||||
| Equity Value Per Share | 9.19 |
What You Will Get
- Editable Forecast Inputs: Easily modify assumptions (growth %, margins, WACC) to create various scenarios.
- Real-World Data: Shoals Technologies Group's (SHLS) financial data pre-loaded to kickstart your analysis.
- Automatic DCF Outputs: The template computes Net Present Value (NPV) and intrinsic value for you.
- Customizable and Professional: A refined Excel model that adjusts to your valuation requirements.
- Built for Analysts and Investors: Perfect for testing projections, validating strategies, and enhancing efficiency.
Key Features
- Comprehensive SHLS Data: Pre-loaded with Shoals Technologies Group’s historical performance metrics and future projections.
- Customizable Assumptions: Modify revenue growth rates, profit margins, weighted average cost of capital (WACC), tax assumptions, and capital expenditures.
- Interactive Valuation Framework: Automatically recalculates Net Present Value (NPV) and intrinsic value based on user-defined parameters.
- Scenario Analysis: Develop various forecasting scenarios to evaluate different valuation possibilities.
- Intuitive Interface: Clean, organized design suitable for both seasoned professionals and newcomers.
How It Works
- Step 1: Download the Excel file.
- Step 2: Review pre-entered Shoals Technologies data (historical and projected).
- Step 3: Adjust key assumptions (yellow cells) based on your analysis.
- Step 4: View automatic recalculations for Shoals Technologies' intrinsic value.
- Step 5: Use the outputs for investment decisions or reporting.
Why Choose Shoals Technologies Group, Inc. (SHLS) Calculator?
- Accuracy: Utilizes real Shoals financial data for precise results.
- Flexibility: Allows users to easily test and adjust inputs as needed.
- Time-Saving: Eliminate the complexity of creating a financial model from the ground up.
- Professional-Grade: Crafted with the precision and usability expected at the CFO level.
- User-Friendly: Intuitive design makes it accessible for users with varying financial expertise.
Who Should Use This Product?
- Investors: Assess Shoals Technologies Group's valuation before making investment decisions.
- CFOs and Financial Analysts: Optimize valuation methodologies and validate financial forecasts.
- Startup Founders: Discover how established companies like Shoals are valued in the market.
- Consultants: Create detailed valuation reports for your clients based on industry standards.
- Students and Educators: Utilize real-time data to learn and teach valuation strategies effectively.
What the Template Contains
- Comprehensive DCF Model: Editable template with detailed valuation calculations tailored for Shoals Technologies Group, Inc. (SHLS).
- Real-World Data: Shoals Technologies’ historical and projected financials preloaded for analysis.
- Customizable Parameters: Adjust WACC, growth rates, and tax assumptions to explore various scenarios.
- Financial Statements: Complete annual and quarterly breakdowns for enhanced insights.
- Key Ratios: Integrated analysis for profitability, efficiency, and leverage metrics.
- Dashboard with Visual Outputs: Charts and tables providing clear, actionable results for informed decision-making.
Disclaimer
All information, articles, and product details provided on this website are for general informational and educational purposes only. We do not claim any ownership over, nor do we intend to infringe upon, any trademarks, copyrights, logos, brand names, or other intellectual property mentioned or depicted on this site. Such intellectual property remains the property of its respective owners, and any references here are made solely for identification or informational purposes, without implying any affiliation, endorsement, or partnership.
We make no representations or warranties, express or implied, regarding the accuracy, completeness, or suitability of any content or products presented. Nothing on this website should be construed as legal, tax, investment, financial, medical, or other professional advice. In addition, no part of this site—including articles or product references—constitutes a solicitation, recommendation, endorsement, advertisement, or offer to buy or sell any securities, franchises, or other financial instruments, particularly in jurisdictions where such activity would be unlawful.
All content is of a general nature and may not address the specific circumstances of any individual or entity. It is not a substitute for professional advice or services. Any actions you take based on the information provided here are strictly at your own risk. You accept full responsibility for any decisions or outcomes arising from your use of this website and agree to release us from any liability in connection with your use of, or reliance upon, the content or products found herein.