
|
Selektive Insurance Group, Inc. (SIGI) DCF -Bewertung |
Fully Editable: Tailor To Your Needs In Excel Or Sheets
Professional Design: Trusted, Industry-Standard Templates
Investor-Approved Valuation Models
MAC/PC Compatible, Fully Unlocked
No Expertise Is Needed; Easy To Follow
Selective Insurance Group, Inc. (SIGI) Bundle
Verbessern Sie Ihre Investitionsauswahl mit dem DCF -Taschenrechner der Selective Insurance Group, Inc. (SIGI)! Nutzen Sie die tatsächlichen Finanzdaten, passen Sie Wachstumsprojektionen und -kosten an und beobachten Sie sofort, wie sich diese Modifikationen auf den inneren Wert der selektiven Versicherungsgruppe, Inc. (SIGI) auswirken.
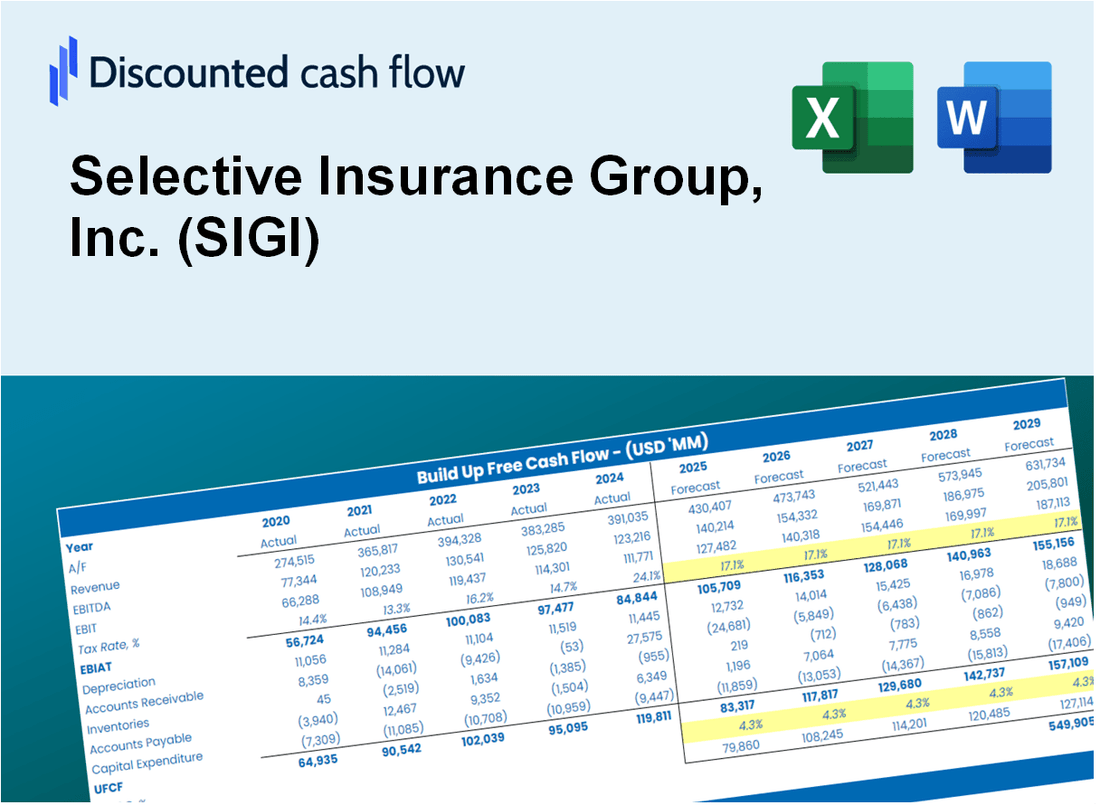
Discounted Cash Flow (DCF) - (USD MM)
| Year | AY1 2020 |
AY2 2021 |
AY3 2022 |
AY4 2023 |
AY5 2024 |
FY1 2025 |
FY2 2026 |
FY3 2027 |
FY4 2028 |
FY5 2029 |
|---|---|---|---|---|---|---|---|---|---|---|
| Revenue | 2,922.3 | 3,379.2 | 3,558.2 | 4,232.3 | 4,861.4 | 5,526.8 | 6,283.2 | 7,143.1 | 8,120.7 | 9,232.0 |
| Revenue Growth, % | 0 | 15.63 | 5.3 | 18.95 | 14.87 | 13.69 | 13.69 | 13.69 | 13.69 | 13.69 |
| EBITDA | 393.2 | 589.6 | 351.4 | 517.3 | 321.7 | 659.0 | 749.2 | 851.7 | 968.2 | 1,100.8 |
| EBITDA, % | 13.45 | 17.45 | 9.87 | 12.22 | 6.62 | 11.92 | 11.92 | 11.92 | 11.92 | 11.92 |
| Depreciation | 59.4 | 55.1 | 42.3 | 30.0 | 34.8 | 69.4 | 78.9 | 89.7 | 102.0 | 115.9 |
| Depreciation, % | 2.03 | 1.63 | 1.19 | 0.70978 | 0.71584 | 1.26 | 1.26 | 1.26 | 1.26 | 1.26 |
| EBIT | 333.8 | 534.5 | 309.0 | 487.2 | 286.9 | 589.6 | 670.3 | 762.0 | 866.3 | 984.9 |
| EBIT, % | 11.42 | 15.82 | 8.69 | 11.51 | 5.9 | 10.67 | 10.67 | 10.67 | 10.67 | 10.67 |
| Total Cash | .4 | .5 | .0 | .2 | 268.6 | 61.4 | 69.8 | 79.4 | 90.2 | 102.6 |
| Total Cash, percent | .0 | .0 | .0 | .0 | .0 | .0 | .0 | .0 | .0 | .0 |
| Account Receivables | 1,468.5 | 1,594.3 | 1,872.0 | 1,969.9 | 2,529.0 | 2,748.0 | 3,124.1 | 3,551.7 | 4,037.7 | 4,590.3 |
| Account Receivables, % | 50.25 | 47.18 | 52.61 | 46.54 | 52.02 | 49.72 | 49.72 | 49.72 | 49.72 | 49.72 |
| Inventories | .0 | .0 | .0 | .0 | .0 | .0 | .0 | .0 | .0 | .0 |
| Inventories, % | 0 | 0 | 0 | 0 | 0 | 0 | 0 | 0 | 0 | 0 |
| Accounts Payable | .0 | .0 | .0 | .0 | .0 | .0 | .0 | .0 | .0 | .0 |
| Accounts Payable, % | 0 | 0 | 0 | 0 | 0 | 0 | 0 | 0 | 0 | 0 |
| Capital Expenditure | -22.1 | -22.2 | -26.0 | -22.6 | -30.8 | -36.6 | -41.6 | -47.3 | -53.8 | -61.1 |
| Capital Expenditure, % | -0.75503 | -0.65587 | -0.73125 | -0.53472 | -0.63376 | -0.66213 | -0.66213 | -0.66213 | -0.66213 | -0.66213 |
| Tax Rate, % | 19.77 | 19.77 | 19.77 | 19.77 | 19.77 | 19.77 | 19.77 | 19.77 | 19.77 | 19.77 |
| EBITAT | 271.4 | 427.1 | 248.0 | 388.2 | 230.2 | 473.3 | 538.1 | 611.7 | 695.4 | 790.6 |
| Depreciation | ||||||||||
| Changes in Account Receivables | ||||||||||
| Changes in Inventories | ||||||||||
| Changes in Accounts Payable | ||||||||||
| Capital Expenditure | ||||||||||
| UFCF | -1,159.8 | 334.3 | -13.4 | 297.7 | -324.9 | 287.0 | 199.3 | 226.5 | 257.6 | 292.8 |
| WACC, % | 4.9 | 4.89 | 4.89 | 4.89 | 4.89 | 4.89 | 4.89 | 4.89 | 4.89 | 4.89 |
| PV UFCF | ||||||||||
| SUM PV UFCF | 1,094.4 | |||||||||
| Long Term Growth Rate, % | 2.00 | |||||||||
| Free cash flow (T + 1) | 299 | |||||||||
| Terminal Value | 10,322 | |||||||||
| Present Terminal Value | 8,129 | |||||||||
| Enterprise Value | 9,224 | |||||||||
| Net Debt | 508 | |||||||||
| Equity Value | 8,716 | |||||||||
| Diluted Shares Outstanding, MM | 61 | |||||||||
| Equity Value Per Share | 142.18 |
What You Will Get
- Real Selective Insurance Data: Preloaded financials – from revenue to EBIT – based on actual and projected figures for Selective Insurance Group, Inc. (SIGI).
- Full Customization: Adjust all critical parameters (yellow cells) like WACC, growth %, and tax rates to suit your analysis needs.
- Instant Valuation Updates: Automatic recalculations to assess the impact of changes on Selective Insurance Group, Inc.'s (SIGI) fair value.
- Versatile Excel Template: Designed for quick edits, scenario testing, and detailed projections specific to Selective Insurance Group, Inc. (SIGI).
- Time-Saving and Accurate: Avoid the hassle of building models from scratch while ensuring precision and flexibility in your analysis.
Key Features
- Comprehensive Financial Insights: Gain access to precise pre-loaded historical data and future forecasts for Selective Insurance Group, Inc. (SIGI).
- Tailorable Projection Variables: Modify highlighted cells for key assumptions like WACC, growth rates, and profit margins.
- Real-Time Calculations: Automatic adjustments to DCF, Net Present Value (NPV), and cash flow assessments.
- Interactive Visualization Tools: Clear charts and summaries to effectively showcase your valuation findings.
- Designed for All Users: An intuitive layout catering to investors, CFOs, and consultants, regardless of experience level.
How It Works
- Download: Obtain the pre-formatted Excel file containing Selective Insurance Group, Inc.'s (SIGI) financial data.
- Customize: Modify projections, such as revenue growth, EBITDA margins, and WACC.
- Update Automatically: The intrinsic value and NPV calculations refresh in real-time.
- Test Scenarios: Develop various forecasts and instantly analyze different outcomes.
- Make Decisions: Leverage the valuation insights to inform your investment choices.
Why Choose This Calculator for Selective Insurance Group, Inc. (SIGI)?
- Accurate Data: Up-to-date Selective Insurance financials provide trustworthy valuation outcomes.
- Customizable: Modify essential parameters such as growth rates, WACC, and tax rates to align with your forecasts.
- Time-Saving: Pre-configured calculations save you the hassle of starting from the ground up.
- Professional-Grade Tool: Tailored for investors, analysts, and consultants in the insurance sector.
- User-Friendly: Easy-to-navigate design and comprehensive instructions cater to users of all experience levels.
Who Should Use This Product?
- Investors: Evaluate Selective Insurance Group's (SIGI) financial health before making investment decisions.
- CFOs and Financial Analysts: Enhance valuation methodologies and analyze financial forecasts.
- Insurance Executives: Understand how public insurance companies like Selective Insurance Group (SIGI) are valued.
- Consultants: Provide accurate valuation assessments and reports for insurance clients.
- Students and Educators: Utilize real-time data to learn and teach valuation strategies in the insurance sector.
What the Template Contains
- Pre-Filled DCF Model: Selective Insurance Group’s (SIGI) financial data preloaded for immediate use.
- WACC Calculator: Detailed calculations for Weighted Average Cost of Capital.
- Financial Ratios: Evaluate Selective Insurance Group’s (SIGI) profitability, leverage, and efficiency.
- Editable Inputs: Change assumptions such as growth, margins, and CAPEX to fit your scenarios.
- Financial Statements: Annual and quarterly reports to support detailed analysis.
- Interactive Dashboard: Easily visualize key valuation metrics and results.
Disclaimer
All information, articles, and product details provided on this website are for general informational and educational purposes only. We do not claim any ownership over, nor do we intend to infringe upon, any trademarks, copyrights, logos, brand names, or other intellectual property mentioned or depicted on this site. Such intellectual property remains the property of its respective owners, and any references here are made solely for identification or informational purposes, without implying any affiliation, endorsement, or partnership.
We make no representations or warranties, express or implied, regarding the accuracy, completeness, or suitability of any content or products presented. Nothing on this website should be construed as legal, tax, investment, financial, medical, or other professional advice. In addition, no part of this site—including articles or product references—constitutes a solicitation, recommendation, endorsement, advertisement, or offer to buy or sell any securities, franchises, or other financial instruments, particularly in jurisdictions where such activity would be unlawful.
All content is of a general nature and may not address the specific circumstances of any individual or entity. It is not a substitute for professional advice or services. Any actions you take based on the information provided here are strictly at your own risk. You accept full responsibility for any decisions or outcomes arising from your use of this website and agree to release us from any liability in connection with your use of, or reliance upon, the content or products found herein.