
|
Skillz Inc. (SKLZ) DCF -Bewertung |
Fully Editable: Tailor To Your Needs In Excel Or Sheets
Professional Design: Trusted, Industry-Standard Templates
Investor-Approved Valuation Models
MAC/PC Compatible, Fully Unlocked
No Expertise Is Needed; Easy To Follow
Skillz Inc. (SKLZ) Bundle
Optimieren Sie Ihre Zeit und steigern Sie die Präzision mit unserem DCF -Taschenrechner von Skillz Inc. (SKLZ)! Dieses Tool ausgestattet mit tatsächlichen Skillz -Daten und anpassbaren Annahmen ermöglicht es Ihnen, wie ein erfahrener Investor die Prognose, Analyse und Value Skillz Inc. (SKLZ).
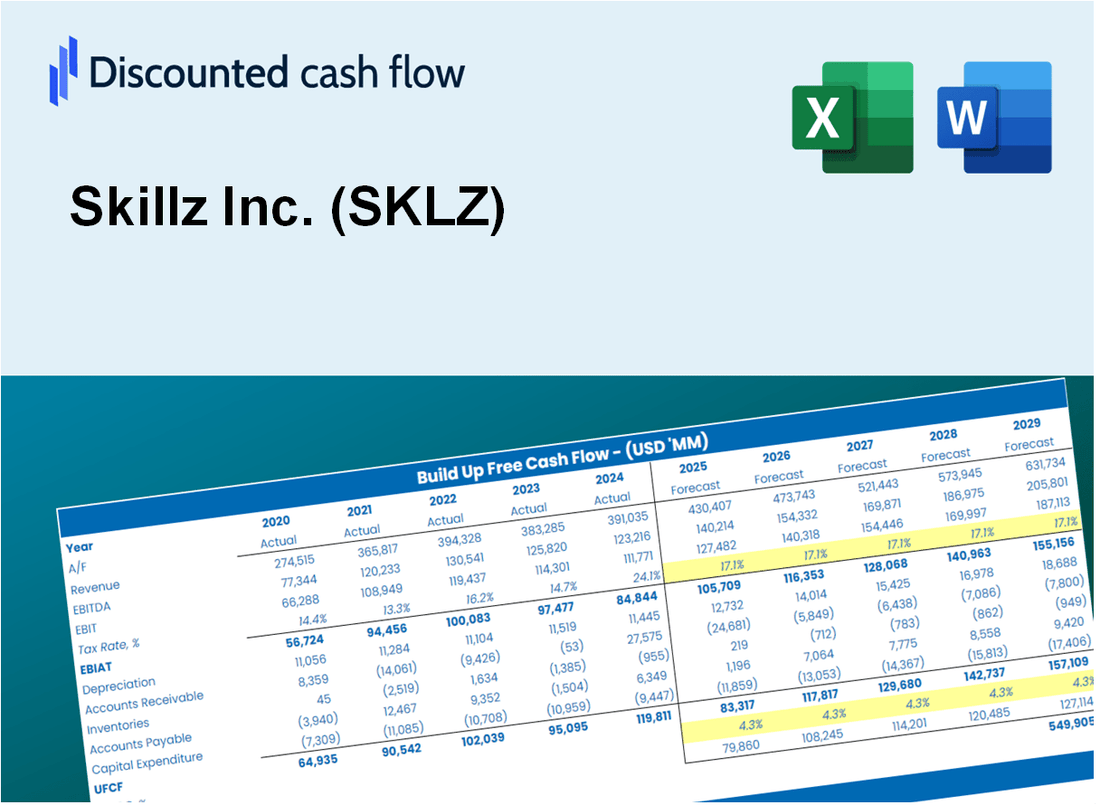
Discounted Cash Flow (DCF) - (USD MM)
| Year | AY1 2020 |
AY2 2021 |
AY3 2022 |
AY4 2023 |
AY5 2024 |
FY1 2025 |
FY2 2026 |
FY3 2027 |
FY4 2028 |
FY5 2029 |
|---|---|---|---|---|---|---|---|---|---|---|
| Revenue | 229.0 | 380.2 | 269.7 | 152.1 | 95.5 | 85.0 | 75.7 | 67.3 | 60.0 | 53.4 |
| Revenue Growth, % | 0 | 65.97 | -29.05 | -43.61 | -37.23 | -10.98 | -10.98 | -10.98 | -10.98 | -10.98 |
| EBITDA | -146.0 | -194.2 | -394.8 | -96.3 | -92.8 | -63.8 | -56.8 | -50.6 | -45.0 | -40.1 |
| EBITDA, % | -63.76 | -51.08 | -146.38 | -63.33 | -97.19 | -75.07 | -75.07 | -75.07 | -75.07 | -75.07 |
| Depreciation | 1.6 | 11.7 | 17.9 | 2.0 | 1.6 | 2.3 | 2.0 | 1.8 | 1.6 | 1.4 |
| Depreciation, % | 0.70248 | 3.07 | 6.63 | 1.29 | 1.64 | 2.67 | 2.67 | 2.67 | 2.67 | 2.67 |
| EBIT | -147.6 | -205.8 | -412.7 | -98.3 | -94.4 | -64.9 | -57.8 | -51.5 | -45.8 | -40.8 |
| EBIT, % | -64.46 | -54.15 | -153.01 | -64.62 | -98.83 | -76.41 | -76.41 | -76.41 | -76.41 | -76.41 |
| Total Cash | 262.7 | 560.4 | 489.8 | 302.0 | 281.9 | 85.0 | 75.7 | 67.3 | 60.0 | 53.4 |
| Total Cash, percent | .0 | .0 | .0 | .0 | .0 | .0 | .0 | .0 | .0 | .0 |
| Account Receivables | .0 | 12.8 | 7.2 | 5.9 | 4.9 | 2.6 | 2.3 | 2.0 | 1.8 | 1.6 |
| Account Receivables, % | 0 | 3.36 | 2.66 | 3.91 | 5.12 | 3.01 | 3.01 | 3.01 | 3.01 | 3.01 |
| Inventories | .0 | .0 | .0 | .0 | .0 | .0 | .0 | .0 | .0 | .0 |
| Inventories, % | 0 | 0 | 0 | 0 | 0 | 0 | 0 | 0 | 0 | 0 |
| Accounts Payable | 22.0 | 19.8 | 1.7 | 1.7 | 9.8 | 4.6 | 4.1 | 3.6 | 3.2 | 2.9 |
| Accounts Payable, % | 9.62 | 5.2 | 0.62883 | 1.13 | 10.26 | 5.37 | 5.37 | 5.37 | 5.37 | 5.37 |
| Capital Expenditure | -3.2 | -3.2 | -1.9 | -13.2 | -2.8 | -2.5 | -2.2 | -2.0 | -1.7 | -1.6 |
| Capital Expenditure, % | -1.42 | -0.85123 | -0.7015 | -8.7 | -2.89 | -2.91 | -2.91 | -2.91 | -2.91 | -2.91 |
| Tax Rate, % | -0.12663 | -0.12663 | -0.12663 | -0.12663 | -0.12663 | -0.12663 | -0.12663 | -0.12663 | -0.12663 | -0.12663 |
| EBITAT | -147.8 | -186.8 | -412.4 | -98.5 | -94.5 | -63.7 | -56.7 | -50.5 | -45.0 | -40.0 |
| Depreciation | ||||||||||
| Changes in Account Receivables | ||||||||||
| Changes in Inventories | ||||||||||
| Changes in Accounts Payable | ||||||||||
| Capital Expenditure | ||||||||||
| UFCF | -127.4 | -193.4 | -408.8 | -108.5 | -86.5 | -66.8 | -57.1 | -50.9 | -45.3 | -40.3 |
| WACC, % | 9.66 | 9.46 | 9.65 | 9.66 | 9.66 | 9.62 | 9.62 | 9.62 | 9.62 | 9.62 |
| PV UFCF | ||||||||||
| SUM PV UFCF | -204.0 | |||||||||
| Long Term Growth Rate, % | 2.00 | |||||||||
| Free cash flow (T + 1) | -41 | |||||||||
| Terminal Value | -540 | |||||||||
| Present Terminal Value | -341 | |||||||||
| Enterprise Value | -545 | |||||||||
| Net Debt | -145 | |||||||||
| Equity Value | -400 | |||||||||
| Diluted Shares Outstanding, MM | 18 | |||||||||
| Equity Value Per Share | -22.39 |
What You Will Get
- Editable Excel Template: A fully customizable Excel-based DCF Calculator featuring pre-filled real SKLZ financials.
- Real-World Data: Historical data and forward-looking estimates (as indicated in the yellow cells).
- Forecast Flexibility: Adjust forecast assumptions such as revenue growth, EBITDA %, and WACC.
- Automatic Calculations: Quickly observe how your inputs affect Skillz’s valuation.
- Professional Tool: Designed for investors, CFOs, consultants, and financial analysts.
- User-Friendly Design: Organized for clarity and ease of use, complete with step-by-step instructions.
Key Features
- Comprehensive Skillz Financials: Gain access to reliable pre-loaded historical data and future forecasts.
- Tailored Forecast Parameters: Modify highlighted cells such as WACC, growth rates, and profit margins.
- Real-Time Calculations: Automatic updates for DCF, Net Present Value (NPV), and cash flow assessments.
- User-Friendly Dashboard: Intuitive charts and summaries to easily visualize your valuation outcomes.
- Designed for All Levels: An accessible, straightforward layout suitable for investors, CFOs, and consultants alike.
How It Works
- Download the Template: Gain immediate access to the Excel-based SKLZ DCF Calculator.
- Input Your Assumptions: Modify the yellow-highlighted cells for growth rates, WACC, margins, and additional factors.
- Instant Calculations: The model automatically recalculates Skillz Inc.'s intrinsic value.
- Test Scenarios: Experiment with various assumptions to assess potential changes in valuation.
- Analyze and Decide: Utilize the outcomes to inform your investment or financial analysis.
Why Choose This Calculator for Skillz Inc. (SKLZ)?
- Accurate Data: Utilize real Skillz Inc. financials for trustworthy valuation outcomes.
- Customizable: Tailor essential parameters such as growth rates, WACC, and tax rates to fit your forecasts.
- Time-Saving: Pre-configured calculations streamline the process, saving you from starting from scratch.
- Professional-Grade Tool: Crafted for investors, analysts, and consultants focused on Skillz Inc. (SKLZ).
- User-Friendly: An intuitive design and clear step-by-step guidance make it accessible for all users.
Who Should Use Skillz Inc. (SKLZ)?
- Gamers: Enhance your competitive edge with innovative gaming solutions.
- Game Developers: Utilize a robust platform to launch and monetize your creations.
- Investors: Explore unique investment opportunities in the fast-growing esports market.
- Marketing Professionals: Leverage data-driven insights to optimize user engagement strategies.
- Educators and Students: Discover the intersection of gaming and technology through hands-on projects.
What the Template Contains
- Preloaded SKLZ Data: Historical and projected financial data, including revenue, EBIT, and capital expenditures.
- DCF and WACC Models: Professional-grade sheets for calculating intrinsic value and Weighted Average Cost of Capital.
- Editable Inputs: Yellow-highlighted cells for adjusting revenue growth, tax rates, and discount rates.
- Financial Statements: Comprehensive annual and quarterly financials for deeper analysis.
- Key Ratios: Profitability, leverage, and efficiency ratios to evaluate performance.
- Dashboard and Charts: Visual summaries of valuation outcomes and assumptions.
Disclaimer
All information, articles, and product details provided on this website are for general informational and educational purposes only. We do not claim any ownership over, nor do we intend to infringe upon, any trademarks, copyrights, logos, brand names, or other intellectual property mentioned or depicted on this site. Such intellectual property remains the property of its respective owners, and any references here are made solely for identification or informational purposes, without implying any affiliation, endorsement, or partnership.
We make no representations or warranties, express or implied, regarding the accuracy, completeness, or suitability of any content or products presented. Nothing on this website should be construed as legal, tax, investment, financial, medical, or other professional advice. In addition, no part of this site—including articles or product references—constitutes a solicitation, recommendation, endorsement, advertisement, or offer to buy or sell any securities, franchises, or other financial instruments, particularly in jurisdictions where such activity would be unlawful.
All content is of a general nature and may not address the specific circumstances of any individual or entity. It is not a substitute for professional advice or services. Any actions you take based on the information provided here are strictly at your own risk. You accept full responsibility for any decisions or outcomes arising from your use of this website and agree to release us from any liability in connection with your use of, or reliance upon, the content or products found herein.