
|
Skywest, Inc. (Skyw) DCF -Bewertung |
Fully Editable: Tailor To Your Needs In Excel Or Sheets
Professional Design: Trusted, Industry-Standard Templates
Investor-Approved Valuation Models
MAC/PC Compatible, Fully Unlocked
No Expertise Is Needed; Easy To Follow
SkyWest, Inc. (SKYW) Bundle
Stürzen Sie Ihre Analyse und steigern Sie die Präzision mit unserem DCF -Taschenrechner von SkyWest, Inc. (Skyw)! Mithilfe von Echtzeitdaten für SkyWest und anpassbare Annahmen befindet sich dieses Tool, Sie Skywest wie ein erfahrener Investor zu prognostizieren, zu bewerten und zu bewerten.
What You Will Get
- Pre-Filled Financial Model: SkyWest’s actual data enables precise DCF valuation.
- Full Forecast Control: Adjust revenue growth, margins, WACC, and other key drivers.
- Instant Calculations: Automatic updates ensure you see results as you make changes.
- Investor-Ready Template: A refined Excel file designed for professional-grade valuation.
- Customizable and Reusable: Tailored for flexibility, allowing repeated use for detailed forecasts.
Key Features
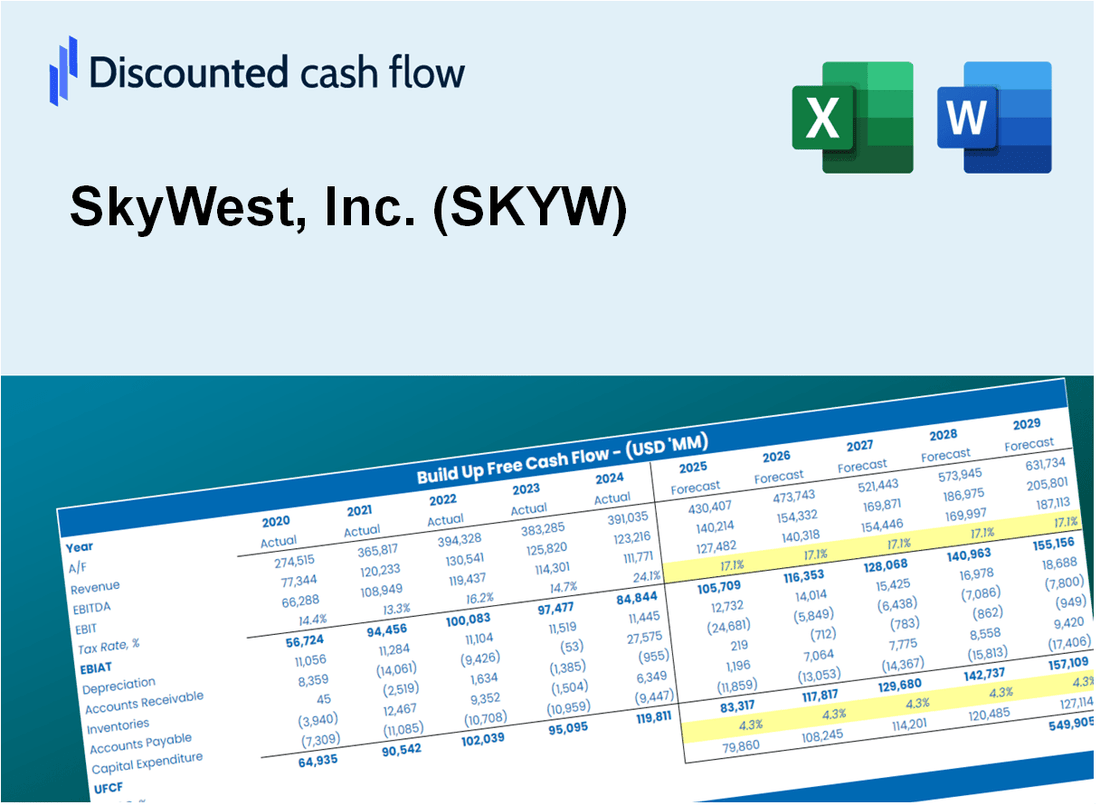
- Accurate SkyWest Financials: Access reliable pre-loaded historical data and future projections for SkyWest, Inc. (SKYW).
- Customizable Forecast Assumptions: Modify highlighted cells for key metrics such as WACC, growth rates, and profit margins.
- Dynamic Calculations: Automatic updates to DCF, Net Present Value (NPV), and cash flow analysis tailored for SkyWest.
- Visual Dashboard: User-friendly charts and summaries to effectively visualize your valuation results for SkyWest, Inc. (SKYW).
- For Professionals and Beginners: An intuitive structure designed for investors, CFOs, and consultants alike.
How It Works
- Step 1: Download the Excel file.
- Step 2: Review pre-entered SkyWest, Inc. (SKYW) data (historical and projected).
- Step 3: Adjust key assumptions (yellow cells) based on your analysis.
- Step 4: View automatic recalculations for SkyWest, Inc. (SKYW)’s intrinsic value.
- Step 5: Use the outputs for investment decisions or reporting.
Why Choose This Calculator for SkyWest, Inc. (SKYW)?
- Accuracy: Utilizes real SkyWest financial data for precise calculations.
- Flexibility: Tailored for users to easily adjust and experiment with inputs.
- Time-Saving: Avoid the complexities of creating a DCF model from the ground up.
- Professional-Grade: Crafted with the expertise and usability expected at the CFO level.
- User-Friendly: Intuitive design makes it accessible for users without extensive financial modeling knowledge.
Who Should Use This Product?
- Professional Investors: Develop comprehensive and accurate valuation models for analyzing SkyWest, Inc. (SKYW) investments.
- Corporate Finance Teams: Evaluate valuation scenarios to inform strategic decisions within the company.
- Consultants and Advisors: Deliver precise valuation insights for clients interested in SkyWest, Inc. (SKYW).
- Students and Educators: Leverage real-world data to enhance learning and practice in financial modeling.
- Aviation Enthusiasts: Gain insights into how airline companies like SkyWest, Inc. (SKYW) are valued in the financial market.
What the Template Contains
- Comprehensive DCF Model: Editable template with detailed valuation calculations tailored for SkyWest, Inc. (SKYW).
- Real-World Data: SkyWest’s historical and projected financials preloaded for in-depth analysis.
- Customizable Parameters: Adjust WACC, growth rates, and tax assumptions to explore various scenarios.
- Financial Statements: Complete annual and quarterly breakdowns for enhanced insights into SkyWest’s performance.
- Key Ratios: Built-in analysis for profitability, efficiency, and leverage specific to SkyWest, Inc. (SKYW).
- Dashboard with Visual Outputs: Charts and tables providing clear, actionable results for informed decision-making.
Disclaimer
All information, articles, and product details provided on this website are for general informational and educational purposes only. We do not claim any ownership over, nor do we intend to infringe upon, any trademarks, copyrights, logos, brand names, or other intellectual property mentioned or depicted on this site. Such intellectual property remains the property of its respective owners, and any references here are made solely for identification or informational purposes, without implying any affiliation, endorsement, or partnership.
We make no representations or warranties, express or implied, regarding the accuracy, completeness, or suitability of any content or products presented. Nothing on this website should be construed as legal, tax, investment, financial, medical, or other professional advice. In addition, no part of this site—including articles or product references—constitutes a solicitation, recommendation, endorsement, advertisement, or offer to buy or sell any securities, franchises, or other financial instruments, particularly in jurisdictions where such activity would be unlawful.
All content is of a general nature and may not address the specific circumstances of any individual or entity. It is not a substitute for professional advice or services. Any actions you take based on the information provided here are strictly at your own risk. You accept full responsibility for any decisions or outcomes arising from your use of this website and agree to release us from any liability in connection with your use of, or reliance upon, the content or products found herein.