
|
SelectQuote, Inc. (SLQT) DCF -Bewertung |
Fully Editable: Tailor To Your Needs In Excel Or Sheets
Professional Design: Trusted, Industry-Standard Templates
Investor-Approved Valuation Models
MAC/PC Compatible, Fully Unlocked
No Expertise Is Needed; Easy To Follow
SelectQuote, Inc. (SLQT) Bundle
Assection SelectQuote, Inc. (SLQT) finanzielle Aussichten wie ein Experte! Dieser (SLQT) DCF-Taschenrechner bietet vorgefüllte Finanzdaten sowie die vollständige Flexibilität, um das Umsatzwachstum, WACC, Margen und andere wesentliche Annahmen zu ändern, um sich an Ihren Projektionen zu übereinstimmen.
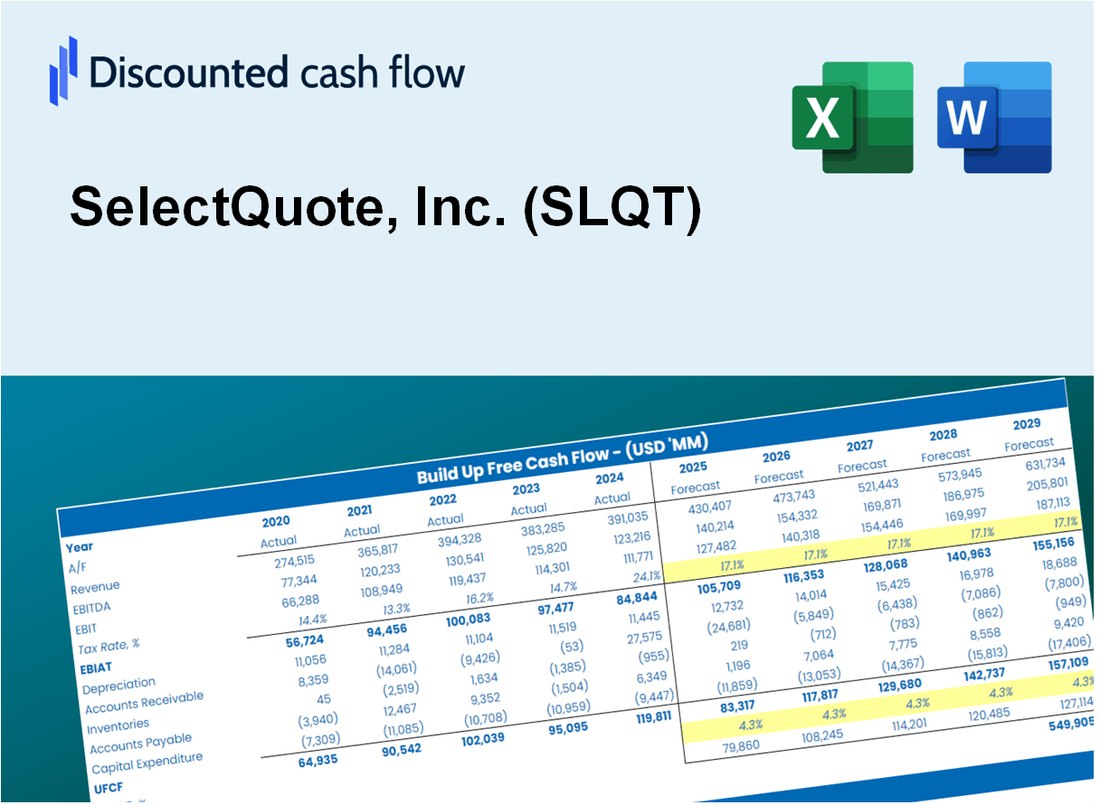
Discounted Cash Flow (DCF) - (USD MM)
| Year | AY1 2021 |
AY2 2022 |
AY3 2023 |
AY4 2024 |
AY5 2025 |
FY1 2026 |
FY2 2027 |
FY3 2028 |
FY4 2029 |
FY5 2030 |
|---|---|---|---|---|---|---|---|---|---|---|
| Revenue | 930.0 | 764.0 | 1,002.8 | 1,321.8 | 1,526.6 | 1,758.3 | 2,025.2 | 2,332.5 | 2,686.5 | 3,094.3 |
| Revenue Growth, % | 0 | -17.84 | 31.26 | 31.8 | 15.5 | 15.18 | 15.18 | 15.18 | 15.18 | 15.18 |
| EBITDA | 203.5 | -321.5 | 39.3 | 89.5 | 148.4 | .8 | .9 | 1.0 | 1.1 | 1.3 |
| EBITDA, % | 21.88 | -42.08 | 3.92 | 6.77 | 9.72 | 0.04277208 | 0.04277208 | 0.04277208 | 0.04277208 | 0.04277208 |
| Depreciation | 16.1 | 24.7 | 27.9 | 25.0 | 20.5 | 38.6 | 44.5 | 51.2 | 59.0 | 68.0 |
| Depreciation, % | 1.74 | 3.24 | 2.78 | 1.89 | 1.34 | 2.2 | 2.2 | 2.2 | 2.2 | 2.2 |
| EBIT | 187.3 | -346.2 | 11.5 | 64.5 | 127.9 | -37.9 | -43.6 | -50.2 | -57.9 | -66.6 |
| EBIT, % | 20.14 | -45.31 | 1.14 | 4.88 | 8.38 | -2.15 | -2.15 | -2.15 | -2.15 | -2.15 |
| Total Cash | 286.5 | 141.0 | 83.2 | 42.7 | 32.4 | 221.2 | 254.8 | 293.4 | 338.0 | 389.3 |
| Total Cash, percent | .0 | .0 | .0 | .0 | .0 | .0 | .0 | .0 | .0 | .0 |
| Account Receivables | 194.5 | 248.1 | 267.4 | 270.9 | 283.5 | 418.9 | 482.4 | 555.7 | 640.0 | 737.1 |
| Account Receivables, % | 20.91 | 32.47 | 26.67 | 20.49 | 18.57 | 23.82 | 23.82 | 23.82 | 23.82 | 23.82 |
| Inventories | .2 | 5.8 | 5.6 | 8.8 | .0 | 7.0 | 8.1 | 9.3 | 10.7 | 12.3 |
| Inventories, % | 0.01892512 | 0.7531 | 0.55512 | 0.66259 | 0 | 0.39795 | 0.39795 | 0.39795 | 0.39795 | 0.39795 |
| Accounts Payable | 34.1 | 24.8 | 27.6 | 36.6 | 59.2 | 57.3 | 66.0 | 76.0 | 87.6 | 100.9 |
| Accounts Payable, % | 3.66 | 3.24 | 2.75 | 2.77 | 3.88 | 3.26 | 3.26 | 3.26 | 3.26 | 3.26 |
| Capital Expenditure | -23.0 | -34.6 | -9.1 | -3.4 | -2.2 | -29.2 | -33.7 | -38.8 | -44.7 | -51.5 |
| Capital Expenditure, % | -2.47 | -4.53 | -0.90991 | -0.25587 | -0.14352 | -1.66 | -1.66 | -1.66 | -1.66 | -1.66 |
| Tax Rate, % | 1.92 | 1.92 | 1.92 | 1.92 | 1.92 | 1.92 | 1.92 | 1.92 | 1.92 | 1.92 |
| EBITAT | 148.0 | -264.2 | 9.7 | 75.7 | 125.4 | -33.2 | -38.2 | -44.0 | -50.7 | -58.4 |
| Depreciation | ||||||||||
| Changes in Account Receivables | ||||||||||
| Changes in Inventories | ||||||||||
| Changes in Accounts Payable | ||||||||||
| Capital Expenditure | ||||||||||
| UFCF | -19.4 | -342.7 | 12.1 | 99.7 | 162.5 | -168.1 | -83.4 | -96.0 | -110.6 | -127.4 |
| WACC, % | 12.77 | 12.46 | 13.43 | 15.2 | 14.98 | 13.77 | 13.77 | 13.77 | 13.77 | 13.77 |
| PV UFCF | ||||||||||
| SUM PV UFCF | -410.1 | |||||||||
| Long Term Growth Rate, % | 2.00 | |||||||||
| Free cash flow (T + 1) | -130 | |||||||||
| Terminal Value | -1,104 | |||||||||
| Present Terminal Value | -579 | |||||||||
| Enterprise Value | -989 | |||||||||
| Net Debt | 384 | |||||||||
| Equity Value | -1,373 | |||||||||
| Diluted Shares Outstanding, MM | 182 | |||||||||
| Equity Value Per Share | -7.55 |
What You Will Get
- Pre-Filled Financial Model: SelectQuote’s actual data enables precise DCF valuation.
- Full Forecast Control: Adjust revenue growth, margins, WACC, and other key drivers.
- Instant Calculations: Automatic updates ensure you see results as you make changes.
- Investor-Ready Template: A refined Excel file designed for professional-grade valuation.
- Customizable and Reusable: Tailored for flexibility, allowing repeated use for detailed forecasts.
Key Features
- Comprehensive DCF Calculator: Features detailed unlevered and levered DCF valuation models tailored for SelectQuote, Inc. (SLQT).
- WACC Calculator: Includes a pre-built Weighted Average Cost of Capital sheet with customizable inputs specific to the insurance sector.
- Customizable Forecast Assumptions: Adjust growth rates, capital expenditures, and discount rates to reflect market conditions.
- Integrated Financial Ratios: Evaluate profitability, leverage, and efficiency ratios relevant to SelectQuote, Inc. (SLQT).
- Interactive Dashboard and Charts: Visual representations summarize essential valuation metrics for straightforward analysis.
How It Works
- 1. Access the Template: Download and open the Excel file containing SelectQuote, Inc.'s (SLQT) preloaded data.
- 2. Adjust Assumptions: Modify essential inputs such as growth rates, WACC, and capital expenditures.
- 3. View Results Instantly: The DCF model automatically calculates intrinsic value and NPV based on your inputs.
- 4. Explore Scenarios: Evaluate various forecasts to assess different valuation outcomes.
- 5. Present with Assurance: Share professional valuation insights to bolster your decision-making process.
Why Choose This Calculator for SelectQuote, Inc. (SLQT)?
- Designed for Experts: A sophisticated tool favored by financial analysts, CFOs, and industry consultants.
- Accurate Data: SelectQuote’s historical and projected financials preloaded for reliable analysis.
- Flexible Scenario Analysis: Easily simulate various forecasts and assumptions to evaluate outcomes.
- Comprehensive Outputs: Automatically computes intrinsic value, NPV, and essential financial metrics.
- User-Friendly: Step-by-step guidance ensures a smooth and intuitive experience.
Who Should Use SelectQuote, Inc. (SLQT)?
- Insurance Professionals: Enhance your understanding of insurance products and sales strategies.
- Financial Advisors: Integrate SelectQuote's offerings into your client solutions and portfolio management.
- Investors: Evaluate the performance and potential of SelectQuote, Inc. (SLQT) within your investment strategy.
- Market Analysts: Utilize data-driven insights to assess market trends and competitive positioning.
- Consumers: Discover how SelectQuote, Inc. (SLQT) can help you find the best insurance options tailored to your needs.
What the Template Contains
- Comprehensive DCF Model: Editable template featuring in-depth valuation calculations.
- Real-World Data: SelectQuote, Inc.'s (SLQT) historical and projected financials preloaded for analysis.
- Customizable Parameters: Modify WACC, growth rates, and tax assumptions to explore different scenarios.
- Financial Statements: Complete annual and quarterly breakdowns for enhanced insights.
- Key Ratios: Integrated analysis for profitability, efficiency, and leverage metrics.
- Dashboard with Visual Outputs: Charts and tables providing clear, actionable results.
Disclaimer
All information, articles, and product details provided on this website are for general informational and educational purposes only. We do not claim any ownership over, nor do we intend to infringe upon, any trademarks, copyrights, logos, brand names, or other intellectual property mentioned or depicted on this site. Such intellectual property remains the property of its respective owners, and any references here are made solely for identification or informational purposes, without implying any affiliation, endorsement, or partnership.
We make no representations or warranties, express or implied, regarding the accuracy, completeness, or suitability of any content or products presented. Nothing on this website should be construed as legal, tax, investment, financial, medical, or other professional advice. In addition, no part of this site—including articles or product references—constitutes a solicitation, recommendation, endorsement, advertisement, or offer to buy or sell any securities, franchises, or other financial instruments, particularly in jurisdictions where such activity would be unlawful.
All content is of a general nature and may not address the specific circumstances of any individual or entity. It is not a substitute for professional advice or services. Any actions you take based on the information provided here are strictly at your own risk. You accept full responsibility for any decisions or outcomes arising from your use of this website and agree to release us from any liability in connection with your use of, or reliance upon, the content or products found herein.