
|
Smiths Group Plc (Smin.L) DCF -Bewertung |
Fully Editable: Tailor To Your Needs In Excel Or Sheets
Professional Design: Trusted, Industry-Standard Templates
Investor-Approved Valuation Models
MAC/PC Compatible, Fully Unlocked
No Expertise Is Needed; Easy To Follow
Smiths Group plc (SMIN.L) Bundle
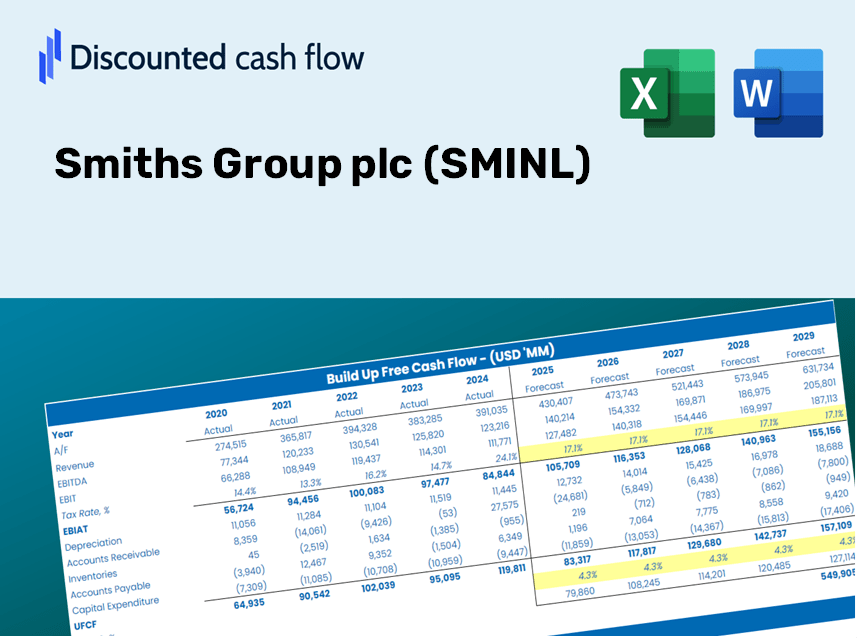
Unabhängig davon, ob Sie ein Investor oder ein Analyst sind, ist dieser (SMINL) DCF-Taschenrechner Ihr Anlaufwerk für eine genaue Bewertung. Mit realen Daten von Smiths Group PLC geladen, können Sie die Prognosen problemlos anpassen und die Effekte in Echtzeit beobachten.
Discounted Cash Flow (DCF) - (USD MM)
| Year | AY1 2020 |
AY2 2021 |
AY3 2022 |
AY4 2023 |
AY5 2024 |
FY1 2025 |
FY2 2026 |
FY3 2027 |
FY4 2028 |
FY5 2029 |
|---|---|---|---|---|---|---|---|---|---|---|
| Revenue | 2,548.0 | 2,406.0 | 2,566.0 | 3,037.0 | 3,132.0 | 3,308.6 | 3,495.3 | 3,692.4 | 3,900.7 | 4,120.7 |
| Revenue Growth, % | 0 | -5.57 | 6.65 | 18.36 | 3.13 | 5.64 | 5.64 | 5.64 | 5.64 | 5.64 |
| EBITDA | 337.0 | 428.0 | 287.0 | 580.0 | 580.0 | 528.2 | 558.0 | 589.4 | 622.7 | 657.8 |
| EBITDA, % | 13.23 | 17.79 | 11.18 | 19.1 | 18.52 | 15.96 | 15.96 | 15.96 | 15.96 | 15.96 |
| Depreciation | 144.0 | 139.0 | 129.0 | 135.0 | 135.0 | 166.8 | 176.2 | 186.2 | 196.7 | 207.8 |
| Depreciation, % | 5.65 | 5.78 | 5.03 | 4.45 | 4.31 | 5.04 | 5.04 | 5.04 | 5.04 | 5.04 |
| EBIT | 193.0 | 289.0 | 158.0 | 445.0 | 445.0 | 361.3 | 381.7 | 403.2 | 426.0 | 450.0 |
| EBIT, % | 7.57 | 12.01 | 6.16 | 14.65 | 14.21 | 10.92 | 10.92 | 10.92 | 10.92 | 10.92 |
| Total Cash | 366.0 | 405.0 | 1,056.0 | 285.0 | 459.0 | 637.8 | 673.8 | 711.8 | 752.0 | 794.4 |
| Total Cash, percent | .0 | .0 | .0 | .0 | .0 | .0 | .0 | .0 | .0 | .0 |
| Account Receivables | 650.0 | 679.0 | 755.0 | 779.0 | 768.0 | 882.3 | 932.0 | 984.6 | 1,040.1 | 1,098.8 |
| Account Receivables, % | 25.51 | 28.22 | 29.42 | 25.65 | 24.52 | 26.67 | 26.67 | 26.67 | 26.67 | 26.67 |
| Inventories | 446.0 | 381.0 | 570.0 | 637.0 | 643.0 | 642.3 | 678.5 | 716.8 | 757.2 | 799.9 |
| Inventories, % | 17.5 | 15.84 | 22.21 | 20.97 | 20.53 | 19.41 | 19.41 | 19.41 | 19.41 | 19.41 |
| Accounts Payable | 178.0 | 188.0 | 282.0 | 247.0 | 274.0 | 282.4 | 298.3 | 315.1 | 332.9 | 351.7 |
| Accounts Payable, % | 6.99 | 7.81 | 10.99 | 8.13 | 8.75 | 8.53 | 8.53 | 8.53 | 8.53 | 8.53 |
| Capital Expenditure | -110.0 | -117.0 | -88.0 | -81.0 | -86.0 | -119.3 | -126.0 | -133.1 | -140.6 | -148.5 |
| Capital Expenditure, % | -4.32 | -4.86 | -3.43 | -2.67 | -2.75 | -3.6 | -3.6 | -3.6 | -3.6 | -3.6 |
| Tax Rate, % | 32.8 | 32.8 | 32.8 | 32.8 | 32.8 | 32.8 | 32.8 | 32.8 | 32.8 | 32.8 |
| EBITAT | 97.2 | 189.1 | 19.9 | 285.5 | 299.1 | 187.7 | 198.3 | 209.5 | 221.3 | 233.8 |
| Depreciation | ||||||||||
| Changes in Account Receivables | ||||||||||
| Changes in Inventories | ||||||||||
| Changes in Accounts Payable | ||||||||||
| Capital Expenditure | ||||||||||
| UFCF | -786.8 | 257.1 | -110.1 | 213.5 | 380.1 | 130.2 | 178.5 | 188.6 | 199.2 | 210.5 |
| WACC, % | 6.4 | 6.52 | 6.11 | 6.51 | 6.54 | 6.42 | 6.42 | 6.42 | 6.42 | 6.42 |
| PV UFCF | ||||||||||
| SUM PV UFCF | 746.0 | |||||||||
| Long Term Growth Rate, % | 4.00 | |||||||||
| Free cash flow (T + 1) | 219 | |||||||||
| Terminal Value | 9,055 | |||||||||
| Present Terminal Value | 6,634 | |||||||||
| Enterprise Value | 7,380 | |||||||||
| Net Debt | 200 | |||||||||
| Equity Value | 7,180 | |||||||||
| Diluted Shares Outstanding, MM | 347 | |||||||||
| Equity Value Per Share | 2,067.57 |
What You Will Receive
- Genuine Smiths Group Financials: Features historical data and projections for precise valuation.
- Customizable Inputs: Adjust WACC, tax rates, revenue growth, and capital expenditures as needed.
- Automated Calculations: Intrinsic value and NPV are computed in real-time.
- Scenario Analysis: Evaluate various scenarios to forecast Smiths Group's future performance.
- User-Friendly Design: Designed for experts but easy for newcomers to navigate.
Key Features
- Customizable Forecast Variables: Adjust essential inputs such as revenue growth, EBITDA margins, and capital expenditures.
- Instant DCF Valuation: Quickly computes intrinsic value, NPV, and additional outputs with ease.
- High-Precision Outcomes: Leverages Smiths Group plc's (SMINL) actual financial data for accurate valuation results.
- Simplified Scenario Analysis: Effortlessly evaluate various assumptions and assess different outcomes.
- Efficient Valuation Solution: Remove the hassle of creating complex valuation models from the ground up.
How It Functions
- Step 1: Download the preconfigured Excel template containing data for Smiths Group plc (SMINL).
- Step 2: Review the filled sheets to familiarize yourself with the essential metrics.
- Step 3: Modify forecasts and assumptions in the editable yellow cells (WACC, growth, margins).
- Step 4: Instantly see the updated results, including the intrinsic value of Smiths Group plc (SMINL).
- Step 5: Use the outputs to make informed investment choices or create reports.
Why Opt for This Calculator?
- All-in-One Solution: Features DCF, WACC, and comprehensive financial ratio analyses in a single tool.
- Flexible Inputs: Modify the yellow-highlighted cells to explore different scenarios.
- In-Depth Analysis: Automatically computes Smiths Group plc's intrinsic value and Net Present Value.
- Preloaded Information: Historical and projected data provide reliable starting points for calculations.
- High-Quality Standards: Perfect for financial analysts, investors, and business consultants alike.
Who Can Benefit from Smiths Group plc (SMINL)?
- Investors: Empower your investment choices with a top-tier valuation resource.
- Financial Analysts: Streamline your workflow with a ready-to-customize DCF model.
- Consultants: Easily modify the template for impactful client presentations or reports.
- Finance Enthusiasts: Enhance your knowledge of valuation methods through practical, real-world examples.
- Educators and Students: Utilize it as a hands-on educational tool in finance courses.
Contents of the Template
- Pre-Filled DCF Model: Smiths Group plc’s financial data preloaded for immediate analysis.
- WACC Calculator: Comprehensive calculations for the Weighted Average Cost of Capital.
- Financial Ratios: Assess Smiths Group plc’s profitability, leverage, and efficiency metrics.
- Editable Inputs: Modify assumptions such as growth rates, margins, and capital expenditures to suit your scenarios.
- Financial Statements: Annual and quarterly reports provided for in-depth analysis.
- Interactive Dashboard: Effortlessly visualize vital valuation metrics and outcomes.
Disclaimer
All information, articles, and product details provided on this website are for general informational and educational purposes only. We do not claim any ownership over, nor do we intend to infringe upon, any trademarks, copyrights, logos, brand names, or other intellectual property mentioned or depicted on this site. Such intellectual property remains the property of its respective owners, and any references here are made solely for identification or informational purposes, without implying any affiliation, endorsement, or partnership.
We make no representations or warranties, express or implied, regarding the accuracy, completeness, or suitability of any content or products presented. Nothing on this website should be construed as legal, tax, investment, financial, medical, or other professional advice. In addition, no part of this site—including articles or product references—constitutes a solicitation, recommendation, endorsement, advertisement, or offer to buy or sell any securities, franchises, or other financial instruments, particularly in jurisdictions where such activity would be unlawful.
All content is of a general nature and may not address the specific circumstances of any individual or entity. It is not a substitute for professional advice or services. Any actions you take based on the information provided here are strictly at your own risk. You accept full responsibility for any decisions or outcomes arising from your use of this website and agree to release us from any liability in connection with your use of, or reliance upon, the content or products found herein.