
|
Schmitt Industries, Inc. (SMIT) DCF -Bewertung |
Fully Editable: Tailor To Your Needs In Excel Or Sheets
Professional Design: Trusted, Industry-Standard Templates
Investor-Approved Valuation Models
MAC/PC Compatible, Fully Unlocked
No Expertise Is Needed; Easy To Follow
Schmitt Industries, Inc. (SMIT) Bundle
Erwerben Sie die Bewertungsanalyse für Schmitt Industries, Inc. (SMIT) mit unserem modernen DCF-Taschenrechner! Diese Excel -Vorlage wird mit realen SMIT -Daten vorgeladen, sodass Sie die Prognosen und Annahmen ändern können, um den inneren Wert von Schmitt Industries genau zu bestimmen.
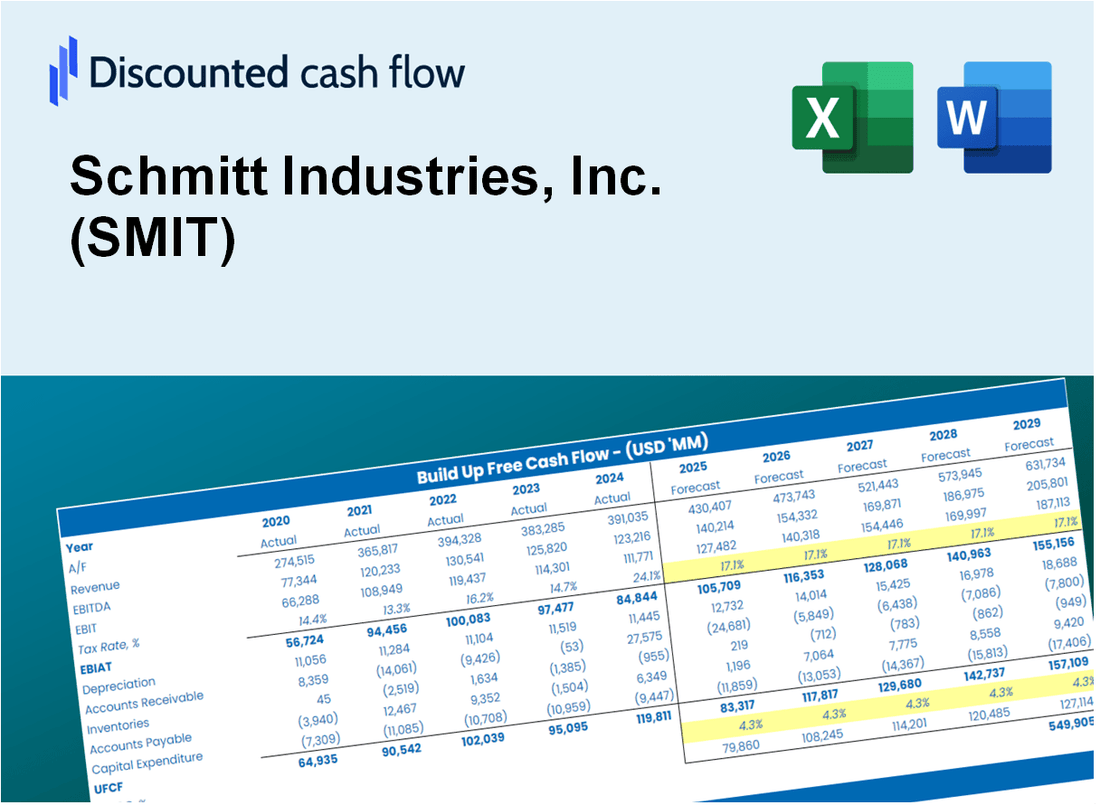
Discounted Cash Flow (DCF) - (USD MM)
| Year | AY1 2018 |
AY2 2019 |
AY3 2020 |
AY4 2021 |
AY5 2022 |
FY1 2023 |
FY2 2024 |
FY3 2025 |
FY4 2026 |
FY5 2027 |
|---|---|---|---|---|---|---|---|---|---|---|
| Revenue | 13.9 | 13.8 | 4.2 | 5.6 | 9.9 | 10.9 | 12.0 | 13.2 | 14.5 | 16.0 |
| Revenue Growth, % | 0 | -0.56093 | -69.66 | 33.66 | 76.65 | 10.02 | 10.02 | 10.02 | 10.02 | 10.02 |
| EBITDA | .2 | -1.3 | -1.7 | -8.6 | -3.2 | -3.9 | -4.3 | -4.8 | -5.2 | -5.8 |
| EBITDA, % | 1.12 | -9.23 | -40.47 | -153.13 | -32.4 | -36.2 | -36.2 | -36.2 | -36.2 | -36.2 |
| Depreciation | .2 | .2 | .2 | .4 | .4 | .4 | .5 | .5 | .5 | .6 |
| Depreciation, % | 1.48 | 1.25 | 3.85 | 7.93 | 4.42 | 3.78 | 3.78 | 3.78 | 3.78 | 3.78 |
| EBIT | .0 | -1.4 | -1.9 | -9.0 | -3.6 | -4.2 | -4.6 | -5.1 | -5.6 | -6.1 |
| EBIT, % | -0.35906 | -10.48 | -44.32 | -161.05 | -36.82 | -38.4 | -38.4 | -38.4 | -38.4 | -38.4 |
| Total Cash | 2.1 | 1.4 | 10.1 | 4.0 | 1.1 | 4.5 | 5.0 | 5.5 | 6.0 | 6.6 |
| Total Cash, percent | .0 | .0 | .0 | .0 | .0 | .0 | .0 | .0 | .0 | .0 |
| Account Receivables | 2.0 | .6 | .6 | .7 | .8 | 1.2 | 1.3 | 1.4 | 1.6 | 1.7 |
| Account Receivables, % | 14.74 | 4.57 | 13.72 | 13.34 | 7.6 | 10.79 | 10.79 | 10.79 | 10.79 | 10.79 |
| Inventories | 5.7 | 5.0 | 1.1 | 1.6 | 1.4 | 3.2 | 3.5 | 3.8 | 4.2 | 4.6 |
| Inventories, % | 41.12 | 36.34 | 25.28 | 27.74 | 14.59 | 29.01 | 29.01 | 29.01 | 29.01 | 29.01 |
| Accounts Payable | 1.0 | .1 | .3 | .6 | .8 | .7 | .8 | .9 | 1.0 | 1.1 |
| Accounts Payable, % | 7.38 | 0.74269 | 6.39 | 10.39 | 8.54 | 6.69 | 6.69 | 6.69 | 6.69 | 6.69 |
| Capital Expenditure | .0 | .0 | .0 | -1.4 | -1.0 | -.8 | -.9 | -1.0 | -1.0 | -1.2 |
| Capital Expenditure, % | -0.06096603 | -0.04687129 | -0.78717 | -25.08 | -10.08 | -7.21 | -7.21 | -7.21 | -7.21 | -7.21 |
| Tax Rate, % | 11 | 11 | 11 | 11 | 11 | 11 | 11 | 11 | 11 | 11 |
| EBITAT | .0 | -1.5 | 3.9 | -8.1 | -3.2 | -3.1 | -3.4 | -3.7 | -4.1 | -4.5 |
| Depreciation | ||||||||||
| Changes in Account Receivables | ||||||||||
| Changes in Inventories | ||||||||||
| Changes in Accounts Payable | ||||||||||
| Capital Expenditure | ||||||||||
| UFCF | -6.6 | -.1 | 8.2 | -9.4 | -3.4 | -5.7 | -4.2 | -4.6 | -5.0 | -5.5 |
| WACC, % | 3.33 | 3.74 | 0.01451015 | 3.35 | 3.33 | 2.76 | 2.76 | 2.76 | 2.76 | 2.76 |
| PV UFCF | ||||||||||
| SUM PV UFCF | -23.0 | |||||||||
| Long Term Growth Rate, % | 2.00 | |||||||||
| Free cash flow (T + 1) | -6 | |||||||||
| Terminal Value | -747 | |||||||||
| Present Terminal Value | -652 | |||||||||
| Enterprise Value | -675 | |||||||||
| Net Debt | 17 | |||||||||
| Equity Value | -692 | |||||||||
| Diluted Shares Outstanding, MM | 4 | |||||||||
| Equity Value Per Share | -181.78 |
What You Will Get
- Real SMIT Financials: Access to both historical and projected data for precise valuation.
- Customizable Inputs: Adjust WACC, tax rates, revenue growth, and capital expenditures as needed.
- Dynamic Calculations: Intrinsic value and NPV are computed automatically.
- Scenario Analysis: Evaluate various scenarios to assess Schmitt Industries' future performance.
- User-Friendly Design: Tailored for professionals while remaining approachable for newcomers.
Key Features
- Real-Life SMIT Data: Pre-filled with Schmitt Industries' historical financials and forward-looking projections.
- Fully Customizable Inputs: Adjust revenue growth, margins, WACC, tax rates, and capital expenditures.
- Dynamic Valuation Model: Automatic updates to Net Present Value (NPV) and intrinsic value based on your inputs.
- Scenario Testing: Create multiple forecast scenarios to analyze different valuation outcomes.
- User-Friendly Design: Simple, structured, and designed for professionals and beginners alike.
How It Works
- Step 1: Download the Excel file.
- Step 2: Review pre-entered Schmitt Industries data (historical and projected).
- Step 3: Adjust key assumptions (yellow cells) based on your analysis.
- Step 4: View automatic recalculations for Schmitt Industries' intrinsic value.
- Step 5: Use the outputs for investment decisions or reporting.
Why Choose This Calculator for Schmitt Industries, Inc. (SMIT)?
- Accuracy: Utilizes real Schmitt Industries financials to ensure precise data.
- Flexibility: Crafted for users to easily test and adjust inputs as needed.
- Time-Saving: Avoid the complexities of constructing a DCF model from the ground up.
- Professional-Grade: Engineered with CFO-level accuracy and user-friendliness in focus.
- User-Friendly: Intuitive design makes it accessible for users without extensive financial modeling skills.
Who Should Use This Product?
- Individual Investors: Make informed decisions about buying or selling Schmitt Industries, Inc. (SMIT) stock.
- Financial Analysts: Streamline valuation processes with ready-to-use financial models for Schmitt Industries, Inc. (SMIT).
- Consultants: Deliver professional valuation insights on Schmitt Industries, Inc. (SMIT) to clients quickly and accurately.
- Business Owners: Understand how companies like Schmitt Industries, Inc. (SMIT) are valued to guide your own strategy.
- Finance Students: Learn valuation techniques using real-world data and scenarios related to Schmitt Industries, Inc. (SMIT).
What the Template Contains
- Operating and Balance Sheet Data: Pre-filled Schmitt Industries historical data and forecasts, including revenue, EBITDA, EBIT, and capital expenditures.
- WACC Calculation: A dedicated sheet for Weighted Average Cost of Capital (WACC), including parameters like Beta, risk-free rate, and share price.
- DCF Valuation (Unlevered and Levered): Editable Discounted Cash Flow models showing intrinsic value with detailed calculations.
- Financial Statements: Pre-loaded financial statements (annual and quarterly) to support analysis.
- Key Ratios: Includes profitability, leverage, and efficiency ratios for Schmitt Industries, Inc. (SMIT).
- Dashboard and Charts: Visual summary of valuation outputs and assumptions to analyze results easily.
Disclaimer
All information, articles, and product details provided on this website are for general informational and educational purposes only. We do not claim any ownership over, nor do we intend to infringe upon, any trademarks, copyrights, logos, brand names, or other intellectual property mentioned or depicted on this site. Such intellectual property remains the property of its respective owners, and any references here are made solely for identification or informational purposes, without implying any affiliation, endorsement, or partnership.
We make no representations or warranties, express or implied, regarding the accuracy, completeness, or suitability of any content or products presented. Nothing on this website should be construed as legal, tax, investment, financial, medical, or other professional advice. In addition, no part of this site—including articles or product references—constitutes a solicitation, recommendation, endorsement, advertisement, or offer to buy or sell any securities, franchises, or other financial instruments, particularly in jurisdictions where such activity would be unlawful.
All content is of a general nature and may not address the specific circumstances of any individual or entity. It is not a substitute for professional advice or services. Any actions you take based on the information provided here are strictly at your own risk. You accept full responsibility for any decisions or outcomes arising from your use of this website and agree to release us from any liability in connection with your use of, or reliance upon, the content or products found herein.