
|
Stryve Foods, Inc. (SNAX) DCF -Bewertung |
Fully Editable: Tailor To Your Needs In Excel Or Sheets
Professional Design: Trusted, Industry-Standard Templates
Investor-Approved Valuation Models
MAC/PC Compatible, Fully Unlocked
No Expertise Is Needed; Easy To Follow
Stryve Foods, Inc. (SNAX) Bundle
Vereinfachen Sie die Bewertung von Stryve Foods, Inc. (SNAX) mit diesem anpassbaren DCF -Taschenrechner! Mit Real Stryve Foods, Inc. (SNAX) Finanzdaten und einstellbaren Prognoseeingaben können Sie Szenarien testen und Stryve Foods, Inc. (SNAX) in Minuten aufdecken.
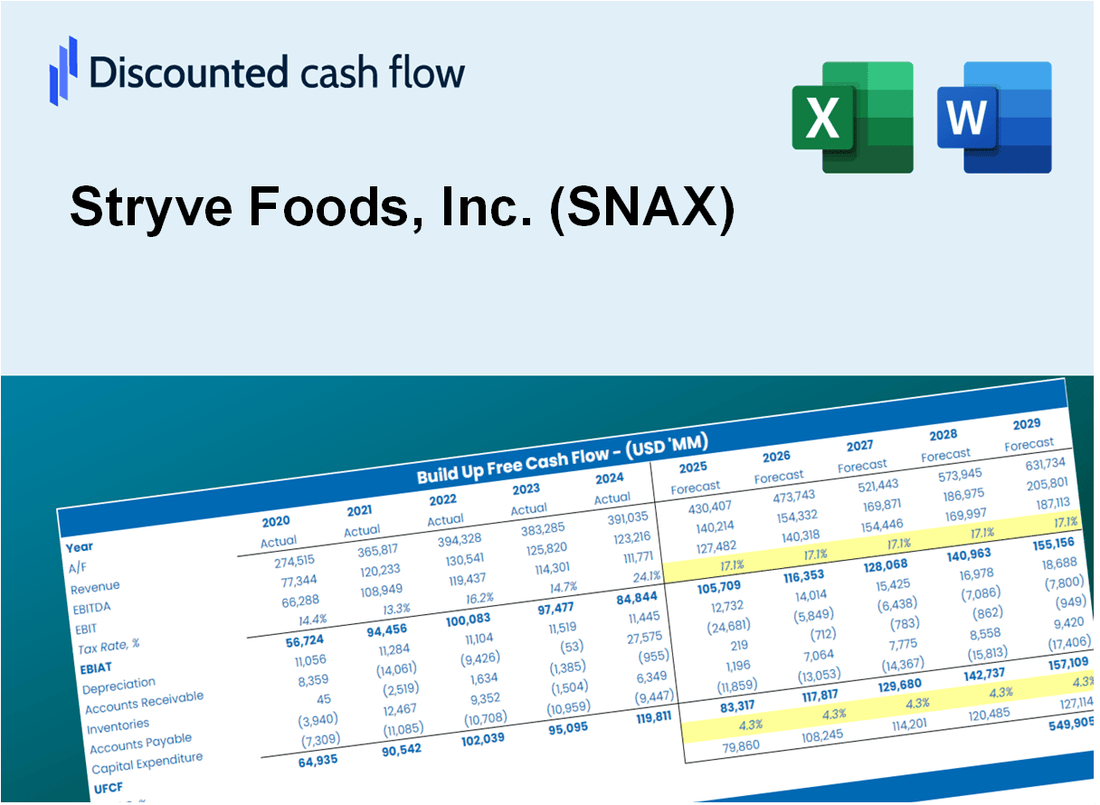
Discounted Cash Flow (DCF) - (USD MM)
| Year | AY1 2019 |
AY2 2020 |
AY3 2021 |
AY4 2022 |
AY5 2023 |
FY1 2024 |
FY2 2025 |
FY3 2026 |
FY4 2027 |
FY5 2028 |
|---|---|---|---|---|---|---|---|---|---|---|
| Revenue | 10.8 | 17.0 | 30.1 | 29.9 | 17.7 | 21.8 | 27.0 | 33.3 | 41.0 | 50.6 |
| Revenue Growth, % | 0 | 57.86 | 76.93 | -0.4521 | -40.86 | 23.37 | 23.37 | 23.37 | 23.37 | 23.37 |
| EBITDA | 2.9 | -13.0 | -27.3 | -30.1 | -12.8 | -13.7 | -16.9 | -20.8 | -25.7 | -31.7 |
| EBITDA, % | 26.48 | -76.2 | -90.79 | -100.64 | -72.2 | -62.54 | -62.54 | -62.54 | -62.54 | -62.54 |
| Depreciation | 1.1 | 1.3 | 1.6 | 2.2 | 2.6 | 2.0 | 2.4 | 3.0 | 3.7 | 4.6 |
| Depreciation, % | 10.12 | 7.59 | 5.39 | 7.29 | 14.8 | 9.04 | 9.04 | 9.04 | 9.04 | 9.04 |
| EBIT | 1.8 | -14.2 | -28.9 | -32.3 | -15.4 | -15.3 | -18.9 | -23.3 | -28.8 | -35.5 |
| EBIT, % | 16.36 | -83.78 | -96.18 | -107.93 | -87 | -70.12 | -70.12 | -70.12 | -70.12 | -70.12 |
| Total Cash | .4 | .6 | 2.2 | .6 | .4 | .8 | 1.0 | 1.2 | 1.5 | 1.9 |
| Total Cash, percent | .0 | .0 | .0 | .0 | .0 | .0 | .0 | .0 | .0 | .0 |
| Account Receivables | .0 | .7 | 3.1 | 2.5 | 2.1 | 1.5 | 1.9 | 2.3 | 2.8 | 3.5 |
| Account Receivables, % | 0 | 3.99 | 10.35 | 8.31 | 11.81 | 6.89 | 6.89 | 6.89 | 6.89 | 6.89 |
| Inventories | 1.8 | 3.4 | 7.2 | 8.3 | 5.2 | 5.1 | 6.3 | 7.8 | 9.6 | 11.9 |
| Inventories, % | 16.38 | 19.84 | 23.99 | 27.58 | 29.36 | 23.43 | 23.43 | 23.43 | 23.43 | 23.43 |
| Accounts Payable | .0 | 3.8 | 3.1 | 3.0 | 4.5 | 3.0 | 3.7 | 4.5 | 5.6 | 6.9 |
| Accounts Payable, % | 0 | 22.58 | 10.3 | 10.05 | 25.18 | 13.62 | 13.62 | 13.62 | 13.62 | 13.62 |
| Capital Expenditure | -1.3 | -1.0 | -1.4 | -3.8 | -.1 | -1.6 | -2.0 | -2.4 | -3.0 | -3.7 |
| Capital Expenditure, % | -12.3 | -6.16 | -4.77 | -12.55 | -0.56301 | -7.27 | -7.27 | -7.27 | -7.27 | -7.27 |
| Tax Rate, % | -0.0052521 | -0.0052521 | -0.0052521 | -0.0052521 | -0.0052521 | -0.0052521 | -0.0052521 | -0.0052521 | -0.0052521 | -0.0052521 |
| EBITAT | -.3 | -14.2 | -29.0 | -32.2 | -15.4 | -12.2 | -15.1 | -18.6 | -23.0 | -28.4 |
| Depreciation | ||||||||||
| Changes in Account Receivables | ||||||||||
| Changes in Inventories | ||||||||||
| Changes in Accounts Payable | ||||||||||
| Capital Expenditure | ||||||||||
| UFCF | -2.3 | -12.5 | -35.8 | -34.3 | -8.0 | -12.7 | -15.5 | -19.1 | -23.6 | -29.1 |
| WACC, % | 0.00187684 | 15.15 | 15.15 | 15.11 | 15.15 | 12.11 | 12.11 | 12.11 | 12.11 | 12.11 |
| PV UFCF | ||||||||||
| SUM PV UFCF | -68.5 | |||||||||
| Long Term Growth Rate, % | 2.00 | |||||||||
| Free cash flow (T + 1) | -30 | |||||||||
| Terminal Value | -293 | |||||||||
| Present Terminal Value | -166 | |||||||||
| Enterprise Value | -234 | |||||||||
| Net Debt | 24 | |||||||||
| Equity Value | -258 | |||||||||
| Diluted Shares Outstanding, MM | 2 | |||||||||
| Equity Value Per Share | -116.37 |
What You Will Get
- Real Stryve Foods Data: Preloaded financials – from revenue to EBIT – based on actual and projected figures for Stryve Foods, Inc. (SNAX).
- Full Customization: Adjust all critical parameters (yellow cells) such as WACC, growth %, and tax rates to fit your analysis.
- Instant Valuation Updates: Automatic recalculations to assess the impact of changes on Stryve Foods’ fair value.
- Versatile Excel Template: Designed for quick edits, scenario testing, and detailed projections specific to Stryve Foods, Inc. (SNAX).
- Time-Saving and Accurate: Avoid the hassle of building models from scratch while ensuring precision and flexibility.
Key Features
- Customizable Growth Metrics: Adjust essential variables such as sales growth, profit margins, and investment levels.
- Instant DCF Valuation: Quickly computes intrinsic value, net present value, and additional financial metrics.
- High-Precision Analysis: Incorporates Stryve Foods' actual financial data for accurate valuation results.
- Streamlined Scenario Testing: Easily explore various assumptions and analyze their impacts on outcomes.
- Efficiency Booster: Save time by avoiding the creation of intricate valuation models from the ground up.
How It Works
- Step 1: Download the prebuilt Excel template containing Stryve Foods, Inc. (SNAX) data.
- Step 2: Navigate through the pre-filled sheets to familiarize yourself with the essential metrics.
- Step 3: Modify forecasts and assumptions in the editable yellow cells (WACC, growth, margins).
- Step 4: Instantly see the updated results, including the intrinsic value of Stryve Foods, Inc. (SNAX).
- Step 5: Utilize the outputs to make informed investment decisions or create detailed reports.
Why Choose This Calculator for Stryve Foods, Inc. (SNAX)?
- Accurate Data: Access to real Stryve Foods financials ensures dependable valuation outcomes.
- Customizable: Tailor essential parameters such as growth rates, WACC, and tax rates to align with your forecasts.
- Time-Saving: Pre-configured calculations remove the hassle of starting from the ground up.
- Professional-Grade Tool: Crafted for investors, analysts, and consultants focused on Stryve Foods.
- User-Friendly: An intuitive design and step-by-step guidance simplify usage for everyone.
Who Should Use This Product?
- Individual Investors: Gain insights to make informed decisions about buying or selling Stryve Foods stock (SNAX).
- Financial Analysts: Enhance valuation processes with comprehensive financial models tailored for Stryve Foods (SNAX).
- Consultants: Provide clients with accurate and timely valuation insights related to Stryve Foods (SNAX).
- Business Owners: Learn how companies like Stryve Foods (SNAX) are valued to inform your own business strategies.
- Finance Students: Master valuation techniques through the analysis of real-world data from Stryve Foods (SNAX).
What the Template Contains
- Preloaded SNAX Data: Historical and projected financial data, including revenue, EBIT, and capital expenditures.
- DCF and WACC Models: Professional-grade sheets for calculating intrinsic value and Weighted Average Cost of Capital.
- Editable Inputs: Yellow-highlighted cells for adjusting revenue growth, tax rates, and discount rates.
- Financial Statements: Comprehensive annual and quarterly financials for deeper analysis.
- Key Ratios: Profitability, leverage, and efficiency ratios to evaluate performance.
- Dashboard and Charts: Visual summaries of valuation outcomes and assumptions.
Disclaimer
All information, articles, and product details provided on this website are for general informational and educational purposes only. We do not claim any ownership over, nor do we intend to infringe upon, any trademarks, copyrights, logos, brand names, or other intellectual property mentioned or depicted on this site. Such intellectual property remains the property of its respective owners, and any references here are made solely for identification or informational purposes, without implying any affiliation, endorsement, or partnership.
We make no representations or warranties, express or implied, regarding the accuracy, completeness, or suitability of any content or products presented. Nothing on this website should be construed as legal, tax, investment, financial, medical, or other professional advice. In addition, no part of this site—including articles or product references—constitutes a solicitation, recommendation, endorsement, advertisement, or offer to buy or sell any securities, franchises, or other financial instruments, particularly in jurisdictions where such activity would be unlawful.
All content is of a general nature and may not address the specific circumstances of any individual or entity. It is not a substitute for professional advice or services. Any actions you take based on the information provided here are strictly at your own risk. You accept full responsibility for any decisions or outcomes arising from your use of this website and agree to release us from any liability in connection with your use of, or reliance upon, the content or products found herein.