
|
Sonida Senior Living, Inc. (SNDA) DCF -Bewertung |
Fully Editable: Tailor To Your Needs In Excel Or Sheets
Professional Design: Trusted, Industry-Standard Templates
Investor-Approved Valuation Models
MAC/PC Compatible, Fully Unlocked
No Expertise Is Needed; Easy To Follow
Sonida Senior Living, Inc. (SNDA) Bundle
Entdecken Sie das wahre Potenzial von Sonida Senior Living, Inc. (SNDA) mit unserem fortschrittlichen DCF -Taschenrechner! Passen Sie wesentliche Annahmen an, erkunden Sie verschiedene Szenarien und beurteilen Sie, wie unterschiedliche Faktoren die Bewertung von Sonida Senior Living, Inc. (SNDA) beeinflussen - alles innerhalb einer einzigen Excel -Vorlage.
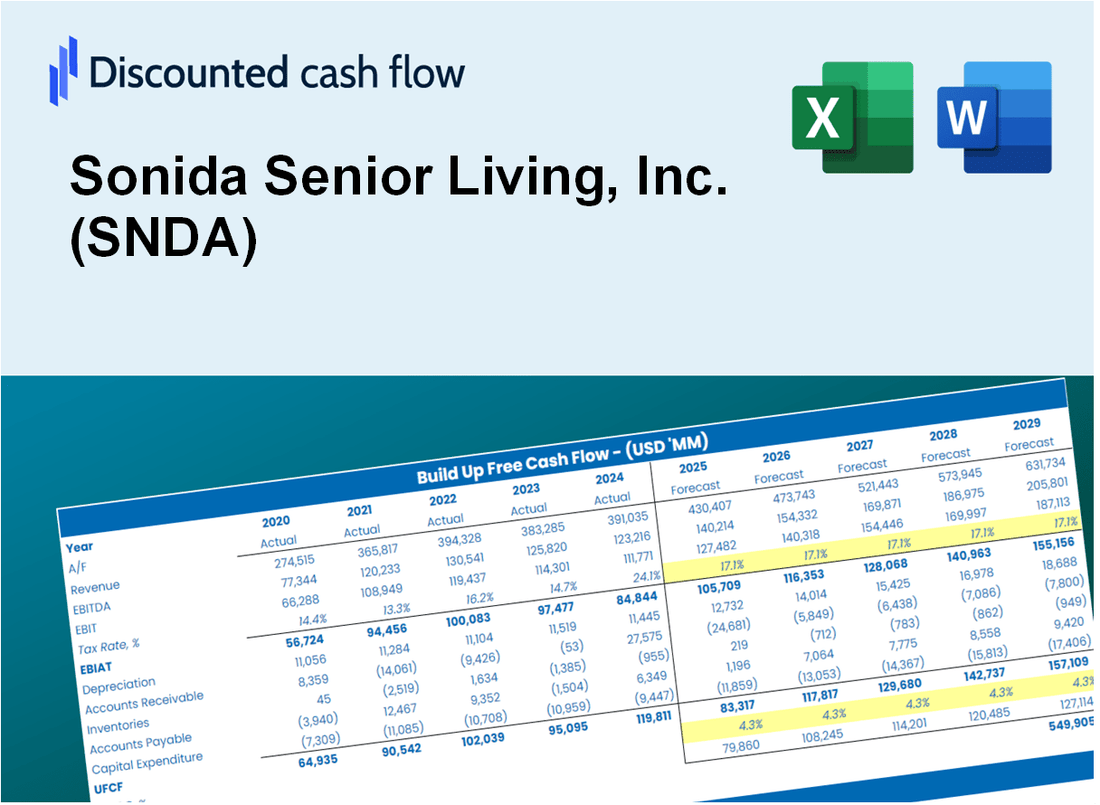
Discounted Cash Flow (DCF) - (USD MM)
| Year | AY1 2020 |
AY2 2021 |
AY3 2022 |
AY4 2023 |
AY5 2024 |
FY1 2025 |
FY2 2026 |
FY3 2027 |
FY4 2028 |
FY5 2029 |
|---|---|---|---|---|---|---|---|---|---|---|
| Revenue | 383.9 | 234.7 | 238.4 | 255.3 | 304.3 | 296.0 | 287.8 | 279.9 | 272.2 | 264.7 |
| Revenue Growth, % | 0 | -38.85 | 1.58 | 7.08 | 19.19 | -2.75 | -2.75 | -2.75 | -2.75 | -2.75 |
| EBITDA | -190.1 | 201.3 | 17.2 | 55.2 | 78.0 | 53.7 | 52.2 | 50.8 | 49.4 | 48.0 |
| EBITDA, % | -49.53 | 85.76 | 7.2 | 21.6 | 25.63 | 18.13 | 18.13 | 18.13 | 18.13 | 18.13 |
| Depreciation | 60.3 | 37.9 | 38.4 | 39.9 | 44.1 | 46.2 | 44.9 | 43.7 | 42.5 | 41.3 |
| Depreciation, % | 15.71 | 16.13 | 16.13 | 15.62 | 14.47 | 15.61 | 15.61 | 15.61 | 15.61 | 15.61 |
| EBIT | -250.4 | 163.4 | -21.3 | 15.3 | 33.9 | 7.5 | 7.3 | 7.1 | 6.9 | 6.7 |
| EBIT, % | -65.24 | 69.63 | -8.93 | 5.98 | 11.16 | 2.52 | 2.52 | 2.52 | 2.52 | 2.52 |
| Total Cash | 17.9 | 78.7 | 16.9 | 4.1 | 17.0 | 31.1 | 30.2 | 29.4 | 28.6 | 27.8 |
| Total Cash, percent | .0 | .0 | .0 | .0 | .0 | .0 | .0 | .0 | .0 | .0 |
| Account Receivables | 5.8 | 4.0 | 6.1 | 8.0 | 19.0 | 9.0 | 8.7 | 8.5 | 8.2 | 8.0 |
| Account Receivables, % | 1.52 | 1.7 | 2.56 | 3.14 | 6.23 | 3.03 | 3.03 | 3.03 | 3.03 | 3.03 |
| Inventories | .0 | .0 | .0 | .0 | .0 | .0 | .0 | .0 | .0 | .0 |
| Inventories, % | 0 | 0 | 0 | 0 | 0 | 0 | 0 | 0 | 0 | 0 |
| Accounts Payable | 15.0 | 9.2 | 7.3 | 11.4 | 9.0 | 10.8 | 10.5 | 10.2 | 10.0 | 9.7 |
| Accounts Payable, % | 3.9 | 3.91 | 3.05 | 4.46 | 2.97 | 3.66 | 3.66 | 3.66 | 3.66 | 3.66 |
| Capital Expenditure | -15.6 | -10.4 | -24.6 | -17.9 | -25.2 | -20.2 | -19.6 | -19.1 | -18.6 | -18.1 |
| Capital Expenditure, % | -4.07 | -4.45 | -10.3 | -7.03 | -8.27 | -6.82 | -6.82 | -6.82 | -6.82 | -6.82 |
| Tax Rate, % | 32.29 | 32.29 | 32.29 | 32.29 | 32.29 | 32.29 | 32.29 | 32.29 | 32.29 | 32.29 |
| EBITAT | -250.7 | 162.7 | -21.3 | 15.4 | 23.0 | 7.0 | 6.8 | 6.6 | 6.4 | 6.2 |
| Depreciation | ||||||||||
| Changes in Account Receivables | ||||||||||
| Changes in Inventories | ||||||||||
| Changes in Accounts Payable | ||||||||||
| Capital Expenditure | ||||||||||
| UFCF | -196.9 | 186.1 | -11.5 | 39.6 | 28.6 | 44.8 | 32.0 | 31.1 | 30.3 | 29.5 |
| WACC, % | 6.08 | 6.06 | 6.08 | 6.08 | 5 | 5.86 | 5.86 | 5.86 | 5.86 | 5.86 |
| PV UFCF | ||||||||||
| SUM PV UFCF | 143.4 | |||||||||
| Long Term Growth Rate, % | 2.00 | |||||||||
| Free cash flow (T + 1) | 30 | |||||||||
| Terminal Value | 779 | |||||||||
| Present Terminal Value | 586 | |||||||||
| Enterprise Value | 730 | |||||||||
| Net Debt | 634 | |||||||||
| Equity Value | 95 | |||||||||
| Diluted Shares Outstanding, MM | 14 | |||||||||
| Equity Value Per Share | 6.74 |
What You Will Receive
- Customizable Excel Template: A fully adaptable Excel-based DCF Calculator featuring pre-filled financial data for Sonida Senior Living, Inc. (SNDA).
- Actual Financial Data: Access to historical figures and forward-looking projections (highlighted in the yellow cells).
- Assumption Flexibility: Modify key forecast parameters such as revenue growth, EBITDA %, and WACC.
- Instant Calculations: Quickly observe how your inputs influence the valuation of Sonida Senior Living, Inc. (SNDA).
- Professional Resource: Designed for investors, CFOs, consultants, and financial analysts.
- Intuitive Layout: Organized for clarity and ease of navigation, complete with step-by-step guidance.
Key Features
- Comprehensive Data: Sonida Senior Living’s historical performance metrics and pre-filled industry forecasts.
- Customizable Inputs: Adjust occupancy rates, operational costs, revenue projections, and profit margins.
- Real-Time Insights: Watch Sonida Senior Living’s intrinsic value update instantly.
- Intuitive Visuals: Dashboard graphs illustrate valuation outcomes and essential performance indicators.
- Designed for Precision: A robust tool tailored for analysts, investors, and finance professionals.
How It Works
- Step 1: Download the prebuilt Excel template featuring Sonida Senior Living, Inc. (SNDA) data.
- Step 2: Review the pre-filled sheets to grasp the essential metrics.
- Step 3: Modify forecasts and assumptions in the editable yellow cells (WACC, growth, margins).
- Step 4: Instantly see the recalculated results, including Sonida Senior Living, Inc.'s (SNDA) intrinsic value.
- Step 5: Make well-informed investment decisions or create reports based on the outputs.
Why Choose Sonida Senior Living, Inc. (SNDA)?
- Enhance Quality of Life: Our communities are designed to promote comfort and well-being for seniors.
- Expert Care: Our dedicated staff is trained to provide exceptional support tailored to individual needs.
- Engaging Activities: We offer a variety of programs that encourage social interaction and mental stimulation.
- Safe Environment: Our facilities prioritize safety and security for peace of mind for residents and families.
- Proven Track Record: Trusted by families and professionals alike for our commitment to excellence in senior living.
Who Should Use Sonida Senior Living, Inc. (SNDA)?
- Investors: Gain insights into the senior living market with a reliable investment platform.
- Financial Analysts: Utilize comprehensive data to enhance your analysis of the senior living sector.
- Consultants: Tailor presentations and reports with up-to-date information on Sonida's operations.
- Healthcare Enthusiasts: Expand your knowledge of senior care services and industry trends.
- Educators and Students: Incorporate real-world case studies into finance and healthcare curricula.
What the Template Contains
- Operating and Balance Sheet Data: Pre-filled Sonida Senior Living historical data and forecasts, including revenue, EBITDA, EBIT, and capital expenditures.
- WACC Calculation: A dedicated sheet for Weighted Average Cost of Capital (WACC), including parameters like Beta, risk-free rate, and share price.
- DCF Valuation (Unlevered and Levered): Editable Discounted Cash Flow models showing intrinsic value with detailed calculations.
- Financial Statements: Pre-loaded financial statements (annual and quarterly) to support analysis.
- Key Ratios: Includes profitability, leverage, and efficiency ratios for Sonida Senior Living, Inc. (SNDA).
- Dashboard and Charts: Visual summary of valuation outputs and assumptions to analyze results easily.
Disclaimer
All information, articles, and product details provided on this website are for general informational and educational purposes only. We do not claim any ownership over, nor do we intend to infringe upon, any trademarks, copyrights, logos, brand names, or other intellectual property mentioned or depicted on this site. Such intellectual property remains the property of its respective owners, and any references here are made solely for identification or informational purposes, without implying any affiliation, endorsement, or partnership.
We make no representations or warranties, express or implied, regarding the accuracy, completeness, or suitability of any content or products presented. Nothing on this website should be construed as legal, tax, investment, financial, medical, or other professional advice. In addition, no part of this site—including articles or product references—constitutes a solicitation, recommendation, endorsement, advertisement, or offer to buy or sell any securities, franchises, or other financial instruments, particularly in jurisdictions where such activity would be unlawful.
All content is of a general nature and may not address the specific circumstances of any individual or entity. It is not a substitute for professional advice or services. Any actions you take based on the information provided here are strictly at your own risk. You accept full responsibility for any decisions or outcomes arising from your use of this website and agree to release us from any liability in connection with your use of, or reliance upon, the content or products found herein.