|
Syndax Pharmaceuticals, Inc. (SNDX) DCF -Bewertung |
Fully Editable: Tailor To Your Needs In Excel Or Sheets
Professional Design: Trusted, Industry-Standard Templates
Investor-Approved Valuation Models
MAC/PC Compatible, Fully Unlocked
No Expertise Is Needed; Easy To Follow
Syndax Pharmaceuticals, Inc. (SNDX) Bundle
Optimieren Sie Ihre Zeit und verbessern Sie die Präzision mit unserem (SNDX) DCF -Taschenrechner! Mit tatsächlichen Daten aus Syndax -Pharmazeutika und anpassbaren Annahmen ermöglichen dieses Tool Sie, Syndax wie ein erfahrener Investor prognostizieren, analysieren und bewerten.
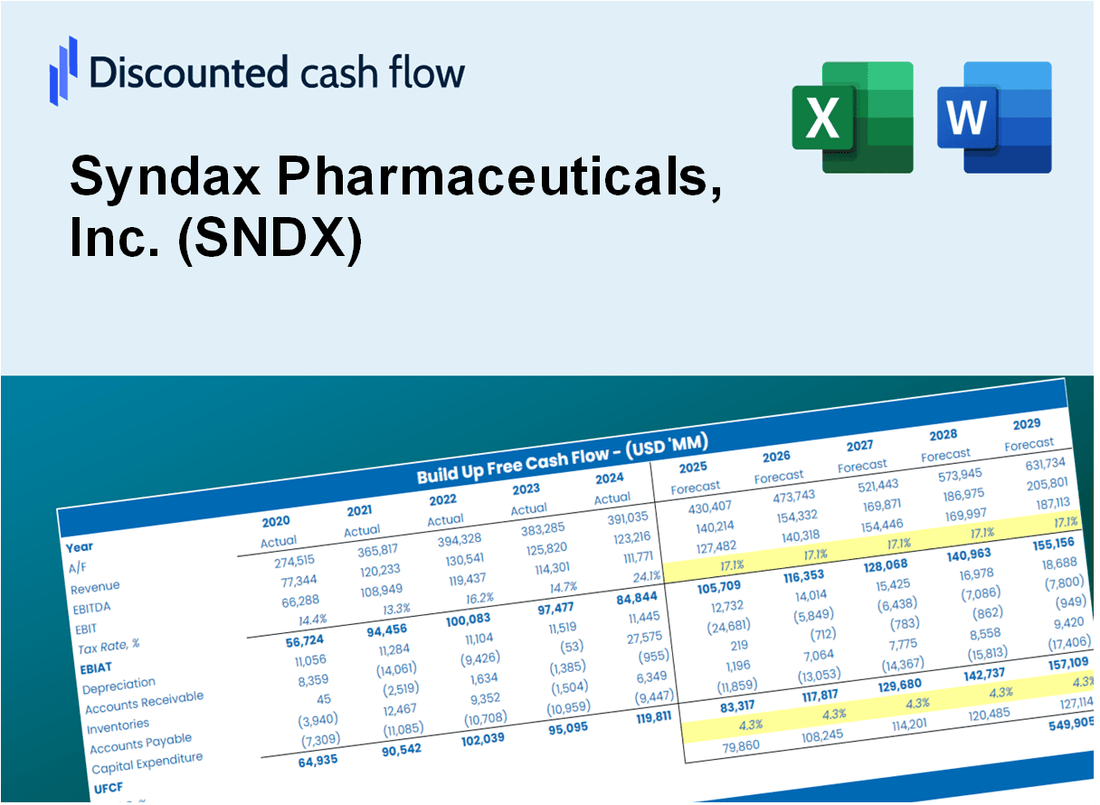
Discounted Cash Flow (DCF) - (USD MM)
| Year | AY1 2020 |
AY2 2021 |
AY3 2022 |
AY4 2023 |
AY5 2024 |
FY1 2025 |
FY2 2026 |
FY3 2027 |
FY4 2028 |
FY5 2029 |
|---|---|---|---|---|---|---|---|---|---|---|
| Revenue | 1.5 | 139.7 | .0 | .0 | 23.7 | 23.7 | 23.7 | 23.7 | 23.7 | 23.7 |
| Revenue Growth, % | 0 | 9109.56 | -100 | 0 | 0 | 0 | 0 | 0 | 0 | 0 |
| EBITDA | -70.3 | 26.9 | -146.2 | -209.1 | -313.8 | .9 | .9 | .9 | .9 | .9 |
| EBITDA, % | -4633.22 | 19.23 | 100 | 100 | -1325.26 | 3.85 | 3.85 | 3.85 | 3.85 | 3.85 |
| Depreciation | .5 | .0 | .0 | .0 | .0 | 11.1 | 11.1 | 11.1 | 11.1 | 11.1 |
| Depreciation, % | 33.95 | 0.03077826 | 100 | 100 | 0.03378378 | 46.8 | 46.8 | 46.8 | 46.8 | 46.8 |
| EBIT | -70.8 | 26.8 | -146.2 | -209.2 | -313.8 | .9 | .9 | .9 | .9 | .9 |
| EBIT, % | -4667.17 | 19.2 | 100 | 100 | -1325.29 | 3.84 | 3.84 | 3.84 | 3.84 | 3.84 |
| Total Cash | 293.1 | 446.8 | 484.4 | 577.6 | 582.9 | 23.7 | 23.7 | 23.7 | 23.7 | 23.7 |
| Total Cash, percent | .0 | .0 | .0 | .0 | .0 | .0 | .0 | .0 | .0 | .0 |
| Account Receivables | .2 | .4 | 4.1 | 1.2 | 13.9 | 12.8 | 12.8 | 12.8 | 12.8 | 12.8 |
| Account Receivables, % | 11.54 | 0.30707 | 100 | 100 | 58.58 | 54.08 | 54.08 | 54.08 | 54.08 | 54.08 |
| Inventories | .0 | .0 | .0 | .0 | .4 | 9.5 | 9.5 | 9.5 | 9.5 | 9.5 |
| Inventories, % | 0 | 0 | 100 | 100 | 1.55 | 40.31 | 40.31 | 40.31 | 40.31 | 40.31 |
| Accounts Payable | 3.5 | 5.7 | 4.4 | 10.0 | 11.6 | 16.7 | 16.7 | 16.7 | 16.7 | 16.7 |
| Accounts Payable, % | 231.25 | 4.06 | 100 | 100 | 49.1 | 70.63 | 70.63 | 70.63 | 70.63 | 70.63 |
| Capital Expenditure | .0 | -.1 | -.2 | .0 | .0 | .0 | .0 | .0 | .0 | .0 |
| Capital Expenditure, % | 0 | -0.09233478 | 100 | 100 | 0 | -0.01846696 | -0.01846696 | -0.01846696 | -0.01846696 | -0.01846696 |
| Tax Rate, % | 0 | 0 | 0 | 0 | 0 | 0 | 0 | 0 | 0 | 0 |
| EBITAT | -70.7 | 26.8 | -146.2 | -209.2 | -313.8 | .9 | .9 | .9 | .9 | .9 |
| Depreciation | ||||||||||
| Changes in Account Receivables | ||||||||||
| Changes in Inventories | ||||||||||
| Changes in Accounts Payable | ||||||||||
| Capital Expenditure | ||||||||||
| UFCF | -66.9 | 28.6 | -151.3 | -200.7 | -325.2 | 9.0 | 12.0 | 12.0 | 12.0 | 12.0 |
| WACC, % | 5.7 | 5.7 | 5.7 | 5.7 | 5.7 | 5.7 | 5.7 | 5.7 | 5.7 | 5.7 |
| PV UFCF | ||||||||||
| SUM PV UFCF | 48.1 | |||||||||
| Long Term Growth Rate, % | 2.00 | |||||||||
| Free cash flow (T + 1) | 12 | |||||||||
| Terminal Value | 331 | |||||||||
| Present Terminal Value | 251 | |||||||||
| Enterprise Value | 299 | |||||||||
| Net Debt | 192 | |||||||||
| Equity Value | 107 | |||||||||
| Diluted Shares Outstanding, MM | 86 | |||||||||
| Equity Value Per Share | 1.25 |
What You Will Get
- Editable Excel Template: A fully customizable Excel-based DCF Calculator featuring pre-filled real SNDX financials.
- Real-World Data: Historical data and forward-looking estimates (as indicated in the yellow cells).
- Forecast Flexibility: Adjust forecast assumptions such as revenue growth, EBITDA %, and WACC.
- Automatic Calculations: Instantly observe how your inputs affect Syndax Pharmaceuticals' valuation.
- Professional Tool: Designed for investors, CFOs, consultants, and financial analysts.
- User-Friendly Design: Organized for clarity and ease of use, complete with step-by-step instructions.
Key Features
- 🔍 Real-Life SNDX Financials: Pre-filled historical and projected data for Syndax Pharmaceuticals, Inc.
- ✏️ Fully Customizable Inputs: Adjust all critical parameters (yellow cells) like WACC, growth %, and tax rates.
- 📊 Professional DCF Valuation: Built-in formulas calculate Syndax’s intrinsic value using the Discounted Cash Flow method.
- ⚡ Instant Results: Visualize Syndax’s valuation instantly after making changes.
- Scenario Analysis: Test and compare outcomes for various financial assumptions side-by-side.
How It Works
- Step 1: Download the Excel file for Syndax Pharmaceuticals, Inc. (SNDX).
- Step 2: Review Syndax’s pre-filled financial data and forecasts.
- Step 3: Modify key inputs such as revenue growth, WACC, and tax rates (highlighted cells).
- Step 4: Observe the DCF model update in real-time as you adjust assumptions.
- Step 5: Analyze the outputs and leverage the results for your investment decisions.
Why Choose This Calculator for Syndax Pharmaceuticals (SNDX)?
- Accuracy: Utilizes real Syndax financial data to ensure precise calculations.
- Flexibility: Tailored for users to easily test and adjust inputs as needed.
- Time-Saving: Avoid the complexity of constructing a DCF model from the ground up.
- Professional-Grade: Crafted with the expertise and usability expected at the CFO level.
- User-Friendly: Intuitive design makes it accessible for users without extensive financial modeling skills.
Who Should Use This Product?
- Individual Investors: Gain insights to make informed decisions about buying or selling Syndax Pharmaceuticals (SNDX) stock.
- Financial Analysts: Enhance valuation processes with comprehensive financial models tailored for Syndax Pharmaceuticals (SNDX).
- Consultants: Provide clients with expert valuation analysis of Syndax Pharmaceuticals (SNDX) swiftly and accurately.
- Business Owners: Learn how biotech companies like Syndax Pharmaceuticals (SNDX) are valued to inform your own business strategy.
- Finance Students: Explore valuation methodologies using real-world data and case studies related to Syndax Pharmaceuticals (SNDX).
What the Template Contains
- Operating and Balance Sheet Data: Pre-filled Syndax Pharmaceuticals historical data and forecasts, including revenue, EBITDA, EBIT, and capital expenditures.
- WACC Calculation: A dedicated sheet for Weighted Average Cost of Capital (WACC), featuring parameters like Beta, risk-free rate, and share price.
- DCF Valuation (Unlevered and Levered): Editable Discounted Cash Flow models illustrating intrinsic value with comprehensive calculations.
- Financial Statements: Pre-loaded financial statements (annual and quarterly) to facilitate analysis.
- Key Ratios: Includes profitability, leverage, and efficiency ratios for Syndax Pharmaceuticals.
- Dashboard and Charts: Visual summary of valuation outputs and assumptions for easy result analysis.
Disclaimer
All information, articles, and product details provided on this website are for general informational and educational purposes only. We do not claim any ownership over, nor do we intend to infringe upon, any trademarks, copyrights, logos, brand names, or other intellectual property mentioned or depicted on this site. Such intellectual property remains the property of its respective owners, and any references here are made solely for identification or informational purposes, without implying any affiliation, endorsement, or partnership.
We make no representations or warranties, express or implied, regarding the accuracy, completeness, or suitability of any content or products presented. Nothing on this website should be construed as legal, tax, investment, financial, medical, or other professional advice. In addition, no part of this site—including articles or product references—constitutes a solicitation, recommendation, endorsement, advertisement, or offer to buy or sell any securities, franchises, or other financial instruments, particularly in jurisdictions where such activity would be unlawful.
All content is of a general nature and may not address the specific circumstances of any individual or entity. It is not a substitute for professional advice or services. Any actions you take based on the information provided here are strictly at your own risk. You accept full responsibility for any decisions or outcomes arising from your use of this website and agree to release us from any liability in connection with your use of, or reliance upon, the content or products found herein.