
|
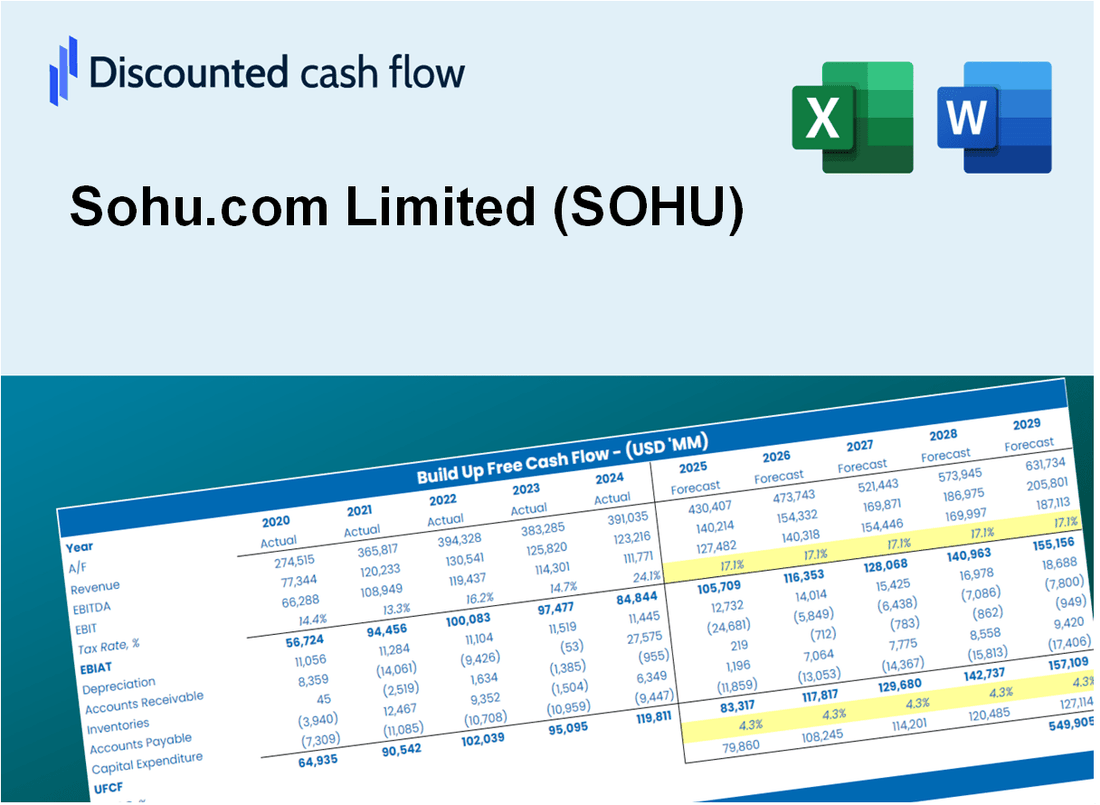
Sohu.com Limited (Sohu) DCF -Bewertung |
Fully Editable: Tailor To Your Needs In Excel Or Sheets
Professional Design: Trusted, Industry-Standard Templates
Investor-Approved Valuation Models
MAC/PC Compatible, Fully Unlocked
No Expertise Is Needed; Easy To Follow
Sohu.com Limited (SOHU) Bundle
Möchten Sie den inneren Wert von Sohu.com begrenzt bestimmen? Unser (SOHU) DCF-Taschenrechner integriert reale Daten mit umfangreichen Anpassungsfunktionen, sodass Sie Prognosen anpassen und Ihre Anlageentscheidungen verbessern können.
What You Will Receive
- Pre-Filled Financial Model: Sohu.com Limited’s (SOHU) actual data provides accurate DCF valuation.
- Comprehensive Forecast Control: Modify revenue growth, profit margins, WACC, and other essential drivers.
- Immediate Calculations: Real-time updates let you view results instantly as you make adjustments.
- Investor-Ready Template: A polished Excel file crafted for professional-level valuation.
- Customizable and Reusable: Designed for adaptability, enabling repeated use for in-depth forecasts.
Key Features
- Customizable Forecast Inputs: Adjust key metrics such as revenue growth, operating margin, and capital investments.
- Instant DCF Valuation: Quickly computes intrinsic value, net present value, and other financial metrics.
- High-Precision Accuracy: Incorporates Sohu.com Limited’s real financial data for dependable valuation results.
- Simplified Scenario Analysis: Easily evaluate various assumptions and analyze the results side by side.
- Efficiency Booster: Avoid the hassle of constructing intricate valuation models from the ground up.
How It Works
- Download the Template: Gain immediate access to the Excel-based SOHU DCF Calculator.
- Input Your Assumptions: Modify the yellow-highlighted cells for growth rates, WACC, margins, and other variables.
- Instant Calculations: The model automatically recalculates Sohu.com Limited’s intrinsic value.
- Test Scenarios: Experiment with various assumptions to assess potential changes in valuation.
- Analyze and Decide: Utilize the results to inform your investment or financial analysis.
Why Choose This Calculator for Sohu.com Limited (SOHU)?
- Comprehensive Tool: Offers DCF, WACC, and financial ratio analyses tailored for Sohu.com Limited.
- Customizable Inputs: Modify yellow-highlighted cells to explore different financial scenarios for (SOHU).
- Detailed Insights: Automatically computes Sohu.com’s intrinsic value and Net Present Value.
- Preloaded Data: Features historical and forecasted data for precise analysis.
- Professional Quality: Perfect for financial analysts, investors, and business consultants focusing on (SOHU).
Who Should Use This Product?
- Individual Investors: Make informed decisions about buying or selling Sohu.com Limited (SOHU) stock.
- Financial Analysts: Streamline valuation processes with ready-to-use financial models for Sohu.com Limited (SOHU).
- Consultants: Deliver professional valuation insights on Sohu.com Limited (SOHU) to clients quickly and accurately.
- Business Owners: Understand how companies like Sohu.com Limited (SOHU) are valued to guide your own strategy.
- Finance Students: Learn valuation techniques using real-world data and scenarios related to Sohu.com Limited (SOHU).
What the Template Contains
- Historical Data: Includes Sohu.com Limited’s past financials and baseline forecasts.
- DCF and Levered DCF Models: Detailed templates to calculate Sohu.com Limited’s intrinsic value.
- WACC Sheet: Pre-built calculations for Weighted Average Cost of Capital.
- Editable Inputs: Modify key drivers like growth rates, EBITDA %, and CAPEX assumptions.
- Quarterly and Annual Statements: A complete breakdown of Sohu.com Limited’s financials.
- Interactive Dashboard: Visualize valuation results and projections dynamically.
Disclaimer
All information, articles, and product details provided on this website are for general informational and educational purposes only. We do not claim any ownership over, nor do we intend to infringe upon, any trademarks, copyrights, logos, brand names, or other intellectual property mentioned or depicted on this site. Such intellectual property remains the property of its respective owners, and any references here are made solely for identification or informational purposes, without implying any affiliation, endorsement, or partnership.
We make no representations or warranties, express or implied, regarding the accuracy, completeness, or suitability of any content or products presented. Nothing on this website should be construed as legal, tax, investment, financial, medical, or other professional advice. In addition, no part of this site—including articles or product references—constitutes a solicitation, recommendation, endorsement, advertisement, or offer to buy or sell any securities, franchises, or other financial instruments, particularly in jurisdictions where such activity would be unlawful.
All content is of a general nature and may not address the specific circumstances of any individual or entity. It is not a substitute for professional advice or services. Any actions you take based on the information provided here are strictly at your own risk. You accept full responsibility for any decisions or outcomes arising from your use of this website and agree to release us from any liability in connection with your use of, or reliance upon, the content or products found herein.