
|
Sonendo, Inc. (Sonx) DCF -Bewertung |
Fully Editable: Tailor To Your Needs In Excel Or Sheets
Professional Design: Trusted, Industry-Standard Templates
Investor-Approved Valuation Models
MAC/PC Compatible, Fully Unlocked
No Expertise Is Needed; Easy To Follow
Sonendo, Inc. (SONX) Bundle
Bewerten Sie den finanziellen Ausblick von Sonendo, Inc. (Sonx) wie ein Experte! Dieser (SONX) DCF-Taschenrechner bietet vorgefüllte Finanzdaten sowie die Flexibilität, das Umsatzwachstum, die WACC, die Gewinnmargen und andere wichtige Annahmen zu ändern, um sich mit Ihren Vorhersagen auszurichten.
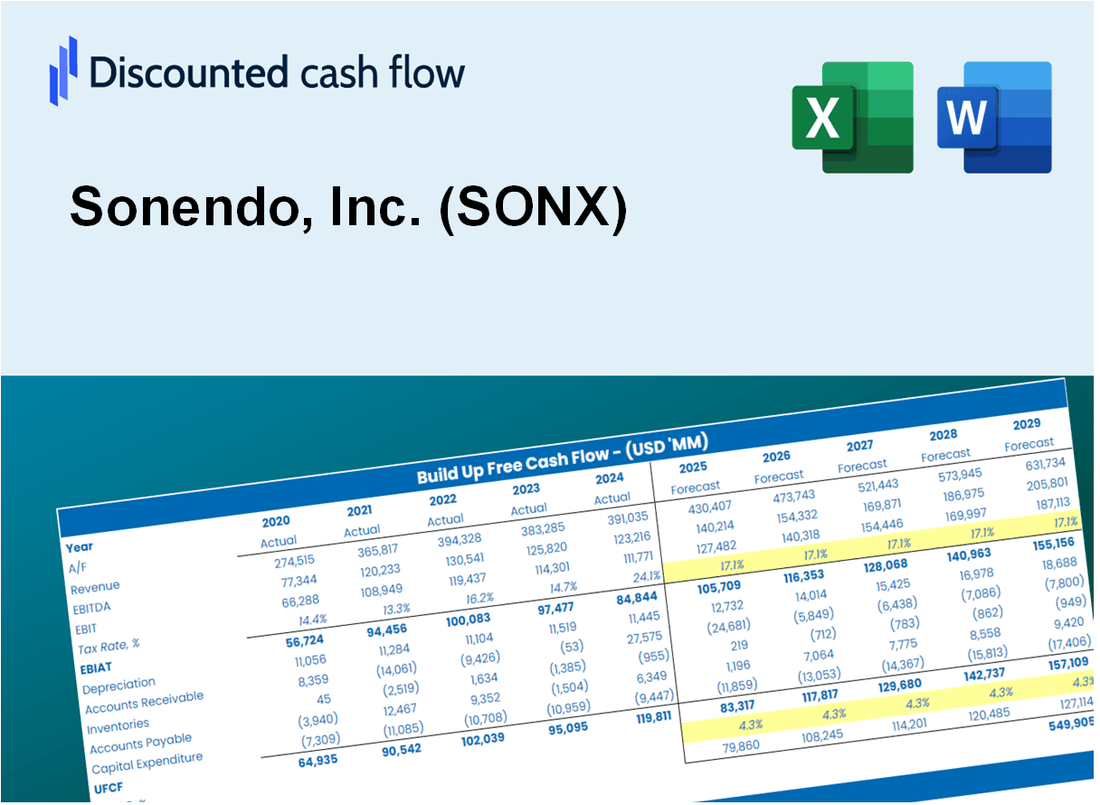
Discounted Cash Flow (DCF) - (USD MM)
| Year | AY1 2020 |
AY2 2021 |
AY3 2022 |
AY4 2023 |
AY5 2024 |
FY1 2025 |
FY2 2026 |
FY3 2027 |
FY4 2028 |
FY5 2029 |
|---|---|---|---|---|---|---|---|---|---|---|
| Revenue | 23.4 | 33.2 | 41.7 | 43.9 | 31.7 | 35.3 | 39.3 | 43.7 | 48.7 | 54.2 |
| Revenue Growth, % | 0 | 42.17 | 25.48 | 5.3 | -27.73 | 11.31 | 11.31 | 11.31 | 11.31 | 11.31 |
| EBITDA | -39.1 | -41.3 | -51.0 | -54.8 | -26.6 | -34.2 | -38.0 | -42.3 | -47.1 | -52.4 |
| EBITDA, % | -167.59 | -124.37 | -122.44 | -124.86 | -83.94 | -96.79 | -96.79 | -96.79 | -96.79 | -96.79 |
| Depreciation | 3.6 | 3.0 | 2.8 | 3.0 | 1.5 | 3.0 | 3.3 | 3.7 | 4.1 | 4.6 |
| Depreciation, % | 15.28 | 9.03 | 6.76 | 6.78 | 4.6 | 8.49 | 8.49 | 8.49 | 8.49 | 8.49 |
| EBIT | -42.7 | -44.3 | -53.8 | -57.7 | -28.1 | -34.5 | -38.4 | -42.7 | -47.5 | -52.9 |
| EBIT, % | -182.87 | -133.39 | -129.2 | -131.64 | -88.54 | -97.71 | -97.71 | -97.71 | -97.71 | -97.71 |
| Total Cash | 51.7 | 84.6 | 91.4 | 46.8 | 11.6 | 30.8 | 34.3 | 38.2 | 42.5 | 47.3 |
| Total Cash, percent | .0 | .0 | .0 | .0 | .0 | .0 | .0 | .0 | .0 | .0 |
| Account Receivables | 1.9 | 2.5 | 5.8 | 5.1 | 3.7 | 3.7 | 4.2 | 4.6 | 5.2 | 5.7 |
| Account Receivables, % | 8.28 | 7.58 | 13.92 | 11.58 | 11.61 | 10.6 | 10.6 | 10.6 | 10.6 | 10.6 |
| Inventories | 4.3 | 8.2 | 15.5 | 11.1 | 10.2 | 9.7 | 10.8 | 12.0 | 13.4 | 14.9 |
| Inventories, % | 18.58 | 24.55 | 37.12 | 25.25 | 32.21 | 27.54 | 27.54 | 27.54 | 27.54 | 27.54 |
| Accounts Payable | 1.9 | 3.1 | 4.4 | 1.2 | 2.0 | 2.6 | 2.9 | 3.2 | 3.6 | 4.0 |
| Accounts Payable, % | 8.27 | 9.22 | 10.65 | 2.68 | 6.19 | 7.4 | 7.4 | 7.4 | 7.4 | 7.4 |
| Capital Expenditure | -.9 | -2.0 | -1.4 | -.9 | -.2 | -1.1 | -1.2 | -1.4 | -1.5 | -1.7 |
| Capital Expenditure, % | -3.92 | -5.94 | -3.26 | -2.12 | -0.50785 | -3.15 | -3.15 | -3.15 | -3.15 | -3.15 |
| Tax Rate, % | 16.42 | 16.42 | 16.42 | 16.42 | 16.42 | 16.42 | 16.42 | 16.42 | 16.42 | 16.42 |
| EBITAT | -42.7 | -44.3 | -53.8 | -57.7 | -23.5 | -33.3 | -37.1 | -41.3 | -46.0 | -51.2 |
| Depreciation | ||||||||||
| Changes in Account Receivables | ||||||||||
| Changes in Inventories | ||||||||||
| Changes in Accounts Payable | ||||||||||
| Capital Expenditure | ||||||||||
| UFCF | -44.4 | -46.5 | -61.6 | -53.9 | -19.1 | -30.4 | -36.2 | -40.3 | -44.9 | -50.0 |
| WACC, % | 26.93 | 26.93 | 26.93 | 26.93 | 23.95 | 26.33 | 26.33 | 26.33 | 26.33 | 26.33 |
| PV UFCF | ||||||||||
| SUM PV UFCF | -99.9 | |||||||||
| Long Term Growth Rate, % | 2.00 | |||||||||
| Free cash flow (T + 1) | -51 | |||||||||
| Terminal Value | -210 | |||||||||
| Present Terminal Value | -65 | |||||||||
| Enterprise Value | -165 | |||||||||
| Net Debt | 8 | |||||||||
| Equity Value | -173 | |||||||||
| Diluted Shares Outstanding, MM | 47 | |||||||||
| Equity Value Per Share | -3.64 |
What You Will Get
- Real SONX Financials: Access to historical and projected data for precise valuation.
- Customizable Inputs: Adjust WACC, tax rates, revenue growth, and capital expenditures as needed.
- Dynamic Calculations: Intrinsic value and NPV are computed automatically.
- Scenario Analysis: Explore various scenarios to assess Sonendo’s future performance.
- User-Friendly Design: Designed for professionals while remaining approachable for newcomers.
Key Features
- Accurate Sonendo Financials: Gain access to reliable pre-loaded historical data and future forecasts.
- Adjustable Forecast Parameters: Modify highlighted cells for WACC, growth rates, and profit margins.
- Real-Time Calculations: Automatic adjustments to DCF, Net Present Value (NPV), and cash flow assessments.
- Interactive Dashboard: User-friendly charts and summaries to help visualize your valuation outcomes.
- Suitable for All Users: A straightforward, intuitive layout designed for investors, CFOs, and consultants alike.
How It Works
- Step 1: Download the prebuilt Excel template featuring Sonendo, Inc. (SONX) data.
- Step 2: Navigate through the pre-filled sheets to familiarize yourself with the essential metrics.
- Step 3: Modify forecasts and assumptions in the editable yellow cells (WACC, growth, margins).
- Step 4: Instantly observe recalculated results, including Sonendo, Inc. (SONX)'s intrinsic value.
- Step 5: Make informed investment choices or create reports based on the outputs.
Why Choose Sonendo, Inc. (SONX)?
- Innovative Technology: Benefit from cutting-edge solutions in dental treatment.
- Enhanced Patient Experience: Our products prioritize comfort and effectiveness for patients.
- Comprehensive Support: Receive ongoing training and resources for optimal product use.
- Proven Results: Backed by clinical studies demonstrating superior outcomes.
- Industry Recognition: Trusted by dental professionals worldwide for quality and reliability.
Who Should Use Sonendo, Inc. (SONX)?
- Healthcare Investors: Make informed investment choices with a comprehensive analysis of Sonendo's market potential.
- Medical Analysts: Streamline your research with an easy-to-use financial model tailored for Sonendo's unique offerings.
- Consultants: Efficiently modify the framework for client discussions or strategic reports on Sonendo's innovations.
- Healthcare Enthusiasts: Enhance your knowledge of dental technology advancements through Sonendo's case studies.
- Educators and Students: Utilize this resource as a practical example in healthcare finance and technology courses.
What the Template Contains
- Pre-Filled DCF Model: Sonendo, Inc.’s (SONX) financial data preloaded for immediate use.
- WACC Calculator: Detailed calculations for Weighted Average Cost of Capital.
- Financial Ratios: Evaluate Sonendo, Inc.’s (SONX) profitability, leverage, and efficiency.
- Editable Inputs: Change assumptions such as growth, margins, and CAPEX to fit your scenarios.
- Financial Statements: Annual and quarterly reports to support detailed analysis.
- Interactive Dashboard: Easily visualize key valuation metrics and results.
Disclaimer
All information, articles, and product details provided on this website are for general informational and educational purposes only. We do not claim any ownership over, nor do we intend to infringe upon, any trademarks, copyrights, logos, brand names, or other intellectual property mentioned or depicted on this site. Such intellectual property remains the property of its respective owners, and any references here are made solely for identification or informational purposes, without implying any affiliation, endorsement, or partnership.
We make no representations or warranties, express or implied, regarding the accuracy, completeness, or suitability of any content or products presented. Nothing on this website should be construed as legal, tax, investment, financial, medical, or other professional advice. In addition, no part of this site—including articles or product references—constitutes a solicitation, recommendation, endorsement, advertisement, or offer to buy or sell any securities, franchises, or other financial instruments, particularly in jurisdictions where such activity would be unlawful.
All content is of a general nature and may not address the specific circumstances of any individual or entity. It is not a substitute for professional advice or services. Any actions you take based on the information provided here are strictly at your own risk. You accept full responsibility for any decisions or outcomes arising from your use of this website and agree to release us from any liability in connection with your use of, or reliance upon, the content or products found herein.