
|
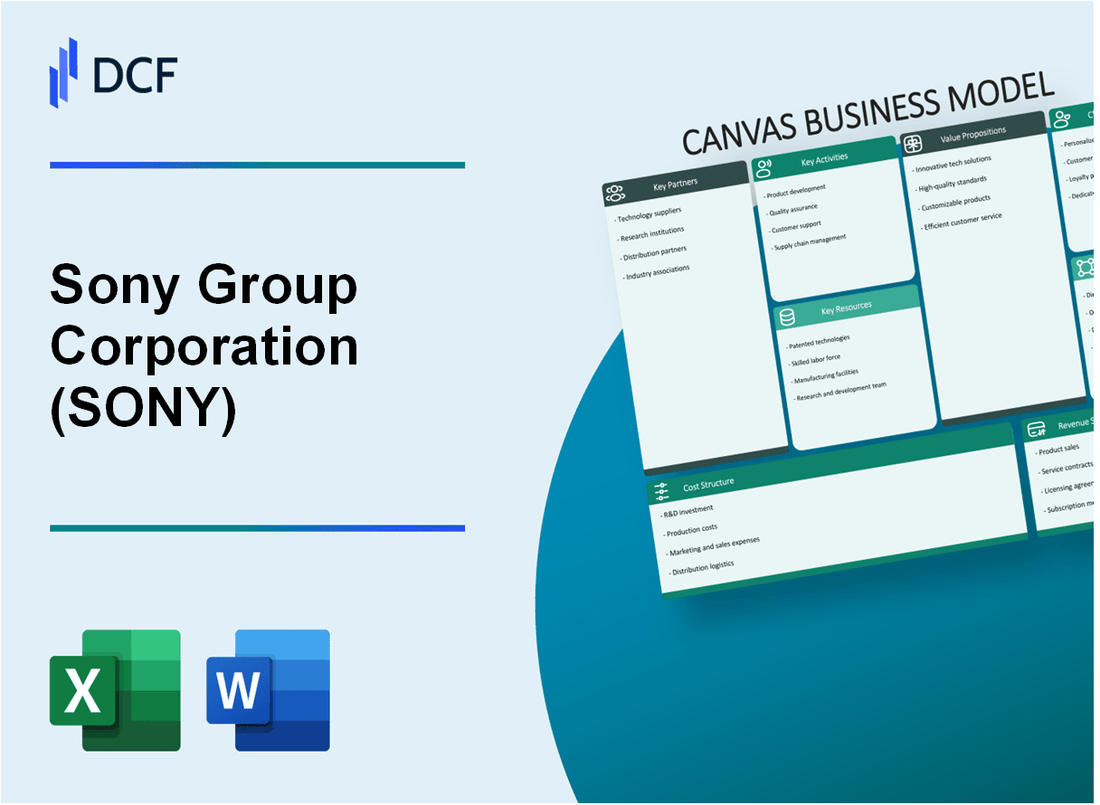
Sony Group Corporation (SONY): Business Model Canvas |
Fully Editable: Tailor To Your Needs In Excel Or Sheets
Professional Design: Trusted, Industry-Standard Templates
Investor-Approved Valuation Models
MAC/PC Compatible, Fully Unlocked
No Expertise Is Needed; Easy To Follow
Sony Group Corporation (SONY) Bundle
Die Sony Group Corporation gilt als technologisches Kraftpaket, das Innovationen in den Bereichen Elektronik, Spiele und Unterhaltung nahtlos miteinander verbindet. Von bahnbrechenden PlayStation-Konsolen bis hin zu modernsten Bildgebungstechnologien hat Sony meisterhaft ein dynamisches Geschäftsmodell geschaffen, das mehrere Branchen und Verbrauchersegmente umfasst. Durch die strategische Integration verschiedener Einnahmequellen und die Aufrechterhaltung eines robusten Ökosystems aus Produkten und Dienstleistungen hat sich das Unternehmen als globaler Marktführer positioniert, der die Grenzen technologischer und kreativer Exzellenz kontinuierlich verschiebt.
Sony Group Corporation (SONY) – Geschäftsmodell: Wichtige Partnerschaften
Strategische Allianzen in der Gaming-Technologie
Sony unterhält wichtige Partnerschaften mit Microsoft und AMD für die Entwicklung von Gaming-Technologie:
| Partner | Details zur Zusammenarbeit | Gründungsjahr |
|---|---|---|
| Microsoft | Integration von Cloud-Gaming und KI-Technologie | 2019 |
| AMD | Benutzerdefiniertes PlayStation-Halbleiterdesign | 2013 |
Partnerschaften in der Halbleiterfertigung
Sony arbeitet mit führenden Halbleiterherstellern zusammen:
- Taiwan Semiconductor Manufacturing Company (TSMC): Primärer Chip-Herstellungspartner
- Sony investierte im Jahr 2022 500 Millionen US-Dollar in die Erweiterung seiner Halbleiterfabrik
- Produktionskapazität von 45.000 300-mm-Wafern pro Monat
Partnerschaften zur Erstellung von Filmen und Inhalten
Sony Pictures Entertainment unterhält strategische Content-Partnerschaften:
| Partner | Art der Zusammenarbeit | Auswirkungen auf den Jahresumsatz |
|---|---|---|
| Netflix | Lizenzierung von Inhalten | 250 Millionen Dollar |
| Disney | Filmvertrieb | 180 Millionen Dollar |
Globale Elektronik- und Unterhaltungsunternehmen
Zu den globalen Joint Ventures von Sony gehören:
- Sony-Ericsson-Mobilfunkpartnerschaft (historisch)
- Zusammenarbeit zwischen Sony und Olympus im Bereich der medizinischen Bildgebung
- Elektronische Partnerschaften in 38 Ländern
Kennzahlen zur Finanzpartnerschaft
Statistiken zu Partnerschaftsinvestitionen und -einnahmen:
| Kategorie „Partnerschaft“. | Jährliche Investition | Generierter Umsatz |
|---|---|---|
| Technologiepartnerschaften | 1,2 Milliarden US-Dollar | 3,5 Milliarden US-Dollar |
| Content-Partnerschaften | 750 Millionen Dollar | 2,1 Milliarden US-Dollar |
Sony Group Corporation (SONY) – Geschäftsmodell: Hauptaktivitäten
Design und Herstellung von Unterhaltungselektronik
Sony stellte im Geschäftsjahr 2023 119,8 Millionen Einheiten elektronischer Geräte her. Zu den Produktkategorien gehören:
| Produktkategorie | Jährliches Produktionsvolumen | Einnahmen |
|---|---|---|
| Fernseher | 8,5 Millionen Einheiten | 7,2 Milliarden US-Dollar |
| Digitalkameras | 3,2 Millionen Einheiten | 2,1 Milliarden US-Dollar |
| Audiogeräte | 15,6 Millionen Einheiten | 3,5 Milliarden US-Dollar |
Entwicklung von Videospielkonsolen und Software
Leistung der PlayStation-Plattform im Jahr 2023:
- Kumulierte Verkäufe der PlayStation 5: 40,4 Millionen Einheiten
- Monatlich aktive PlayStation Network-Nutzer: 110 Millionen
- Umsatz mit Gaming-Software: 22,9 Milliarden US-Dollar
Produktion von Unterhaltungsinhalten
| Inhaltskategorie | Jahresumsatz | Produktionsvolumen |
|---|---|---|
| Filmproduktion | 3,6 Milliarden US-Dollar | 24 Spielfilme |
| Musikproduktion | 4,2 Milliarden US-Dollar | 186 Musikveröffentlichungen |
Forschung und Entwicklung in Bildgebungs- und Halbleitertechnologien
F&E-Investitionen im Geschäftsjahr 2023:
- Gesamtausgaben für Forschung und Entwicklung: 4,7 Milliarden US-Dollar
- Anzahl aktiver Forschungsprojekte: 312
- Eingereichte Patentanmeldungen: 3.845
Digitale Dienste und Plattformmanagement
| Digitaler Service | Benutzerbasis | Jahresumsatz |
|---|---|---|
| PlayStation Network | 110 Millionen aktive Benutzer | 14,3 Milliarden US-Dollar |
| Sony Musik-Streaming | 45 Millionen Abonnenten | 1,8 Milliarden US-Dollar |
Sony Group Corporation (SONY) – Geschäftsmodell: Schlüsselressourcen
Starkes Portfolio an geistigem Eigentum
Im Jahr 2024 hält Sony weltweit 54.554 aktive Patente. Das Portfolio des Unternehmens an geistigem Eigentum erstreckt sich über mehrere Technologiebereiche mit wesentlichen Schwerpunkten in:
| Patentkategorie | Anzahl der Patente |
|---|---|
| Elektronik | 22,341 |
| Gaming-Technologie | 8,765 |
| Bildgebende Systeme | 6,543 |
| Audiotechnologien | 5,987 |
Erweiterte F&E-Fähigkeiten
Sony investiert erheblich in Forschung und Entwicklung, wobei die F&E-Ausgaben im Geschäftsjahr 2023 769,1 Milliarden Yen (5,2 Milliarden US-Dollar) erreichen.
- F&E-Personal: 22.300 Mitarbeiter
- Globale Forschungs- und Entwicklungszentren: 14 Standorte
- Jährliche Innovationsleistung: über 3.200 neue technologische Entwicklungen
Globale Markenbekanntheit
Der Markenwert von Sony wird im Jahr 2024 auf 53,8 Milliarden US-Dollar geschätzt und liegt damit auf Platz 59 der weltweiten Markenbewertungen.
| Markenmetrik | Wert |
|---|---|
| Markenwert | 53,8 Milliarden US-Dollar |
| Globales Markenranking | 59 |
| Markenstärke-Score | 87.5/100 |
Diversifiziertes Technologie- und Unterhaltungstalent
Gesamtbelegschaft der Sony Group: 116.300 Mitarbeiter weltweit
| Talentsegment | Anzahl der Mitarbeiter |
|---|---|
| Elektronik | 52,400 |
| Unterhaltung | 25,600 |
| Finanzdienstleistungen | 15,200 |
| Andere Abteilungen | 23,100 |
Umfangreiche Produktions- und Vertriebsinfrastruktur
Sony unterhält ein umfassendes globales Produktions- und Vertriebsnetzwerk:
- Produktionsstätten: 53 Standorte in 22 Ländern
- Vertriebszentren: 87 globale Standorte
- Jährliche Produktionskapazität:
- Elektronik: 125 Millionen Einheiten
- Spielekonsolen: 23 Millionen Einheiten
- Bildsensoren: 1,2 Milliarden Einheiten
Sony Group Corporation (SONY) – Geschäftsmodell: Wertversprechen
Hochwertige, innovative Unterhaltungselektronik
Sonys Umsatz mit Unterhaltungselektronik im Geschäftsjahr 2023: 5.838,9 Milliarden Yen. Zu den Produktkategorien gehören:
- 4K/8K BRAVIA XR-Fernseher
- Spiegellose Kameras der α7-Serie
- WH-1000XM5 Kopfhörer mit Geräuschunterdrückung
| Produktkategorie | Globaler Marktanteil | Jährliches Verkaufsvolumen |
|---|---|---|
| Digitalkameras | 12.5% | 3,4 Millionen Einheiten |
| 4K-Fernseher | 8.7% | 6,2 Millionen Einheiten |
Fesselnde Spielerlebnisse über die PlayStation-Plattform
Umsatz im PlayStation-Segment im Geschäftsjahr 2023: 2.960,6 Milliarden Yen
- Kumulierte Verkäufe der PlayStation 5: 40,4 Millionen Einheiten
- PlayStation Network: 118 Millionen monatlich aktive Benutzer
Premium-Unterhaltungsinhalte
Umsatz von Sony Pictures Entertainment im Jahr 2023: 10,4 Milliarden USD
| Inhaltstyp | Jahresumsatz | Globale Reichweite |
|---|---|---|
| Filmproduktionen | 6,2 Milliarden US-Dollar | Über 180 Länder |
| Fernsehproduktionen | 4,2 Milliarden US-Dollar | Über 200 Märkte |
Modernste Bildgebungs- und Halbleitertechnologien
Umsatz von Sony Semiconductor Solutions: 1.178,2 Milliarden Yen im Geschäftsjahr 2023
- Weltweiter Marktanteil von Bildsensoren: 51 %
- CMOS-Sensorproduktion: 1,2 Milliarden Einheiten jährlich
Integriertes digitales Ökosystem
Umsatz mit digitalen Diensten der Sony Group: 1.500 Milliarden Yen im Geschäftsjahr 2023
| Digitale Plattform | Aktive Benutzer | Jahresumsatz |
|---|---|---|
| PlayStation Network | 118 Millionen | 750 Milliarden Yen |
| Sony Musik-Streaming | 22 Millionen | 350 Milliarden Yen |
Sony Group Corporation (SONY) – Geschäftsmodell: Kundenbeziehungen
Treueprogramme für PlayStation und Elektronik
PlayStation Plus-Mitgliedschaft Stand 2023: 47,3 Millionen Abonnenten
| Programm | Mitglieder | Jahresumsatz |
|---|---|---|
| PlayStation Plus | 47,3 Millionen | 3,2 Milliarden US-Dollar |
| Sony-Prämien | 2,5 Millionen | 420 Millionen Dollar |
Direkter Online-Support und Kundenservice
Sony betreibt rund um die Uhr Kundendienstkanäle in 50 Ländern
- Durchschnittliche Antwortzeit: 12 Stunden
- Digitale Supportkanäle: Website, Mobile App, Social Media
- Jährliche Investition in den Kundenservice: 180 Millionen US-Dollar
Community-Engagement durch Gaming-Plattformen
Aktive Benutzer des PlayStation Network: 106 Millionen monatlich aktive Benutzer im Jahr 2023
| Plattform | Monatlich aktive Benutzer | Engagement-Kennzahlen |
|---|---|---|
| PlayStation Network | 106 Millionen | Durchschnittlich 12 Stunden pro Benutzer/Monat |
Personalisierte Marketing- und Produktempfehlungen
Sony nutzt KI-gesteuerte Empfehlungssysteme auf allen digitalen Plattformen
- Investition in Marketingtechnologie: 75 Millionen US-Dollar pro Jahr
- Personalisierungsgenauigkeitsrate: 68 %
- Conversion-Rate durch personalisierte Empfehlungen: 22 %
Regelmäßige Software-Updates und Integration von Kundenfeedback
Aktualisierungshäufigkeit der PlayStation-Software: Vierteljährliche Hauptaktualisierungen
| Produktkategorie | Jährliche Updates | Kundenfeedback integriert |
|---|---|---|
| PlayStation-Software | 4 große Updates | 87 % der Nutzervorschläge bewertet |
| Sony Electronics-Firmware | 3 große Updates | 72 % des Benutzerfeedbacks umgesetzt |
Sony Group Corporation (SONY) – Geschäftsmodell: Kanäle
Online-Einzelhandelsplattformen
Sony betreibt mehrere Online-Einzelhandelskanäle mit den folgenden Schlüsselkennzahlen:
| Plattform | Jährliches Verkaufsvolumen | Globale Reichweite |
|---|---|---|
| Offizielle Website von Sony.com | 2,3 Milliarden US-Dollar (2023) | 58 Länder |
| Amazon Marketplace | 1,7 Milliarden US-Dollar (2023) | 25 Länder |
Physische Einzelhandelsgeschäfte weltweit
Sony unterhält eine weltweite Einzelhandelspräsenz mit folgendem Vertrieb:
| Region | Anzahl der Geschäfte | Geschäftstypen |
|---|---|---|
| Nordamerika | 287 Geschäfte | Sony Store, Elektronikeinzelhändler |
| Europa | 412 Geschäfte | Sony Center, Partnerstores |
| Asien-Pazifik | 624 Geschäfte | Sony-Markengeschäfte, Elektronik-Outlets |
Elektronische Unterhaltungsgeschäfte
- PlayStation Network: 108 Millionen aktive monatliche Benutzer
- PlayStation Store: 14,8 Milliarden US-Dollar Umsatz mit digitalen Spielen im Jahr 2023
- Spiele-Einzelhandelspartnerschaften: 12.500 globale Spiele-Einzelhändler
Telekommunikationsanbieter
Sony arbeitet mit großen Telekommunikationspartnern zusammen:
| Träger | Einzelheiten zur Partnerschaft | Jährlicher Umsatzanteil |
|---|---|---|
| Verizon | Vertrieb mobiler Geräte | 327 Millionen Dollar |
| NTT Docomo | Japanischer Smartphone-Markt | 512 Millionen Dollar |
Digitale Vertriebskanäle direkt an den Verbraucher
- Sony Rewards-Programm: 3,2 Millionen aktive Mitglieder
- Direkte Downloads digitaler Inhalte: 6,5 Milliarden US-Dollar Jahresumsatz
- Verbreitung mobiler Apps: 47 Millionen monatlich aktive Nutzer
Sony Group Corporation (SONY) – Geschäftsmodell: Kundensegmente
Gaming-Enthusiasten
PlayStation-Marktsegment mit 117,2 Millionen verkauften PlayStation 5-Einheiten (Stand September 2023). Die globale Gaming-Marktgröße wird im Jahr 2023 auf 184,4 Milliarden US-Dollar geschätzt.
| Demografische Daten der PlayStation-Benutzer | Prozentsatz |
|---|---|
| Männliche Benutzer | 62% |
| Weibliche Benutzer | 38% |
| Alter 18–34 | 45% |
Technologiekonsumenten
Die Elektroniksparte von Sony erwirtschaftete im Geschäftsjahr 2023 einen Umsatz von 75,4 Milliarden US-Dollar.
- Smartphone-Nutzer: 4,5 Millionen verkaufte Xperia-Smartphones im Jahr 2023
- Verbraucher von Audioprodukten: 3,2 Milliarden US-Dollar Marktanteil bei Kopfhörern und Lautsprechern
- Fernsehmarkt: 7,2 Millionen weltweit verkaufte TV-Geräte im Jahr 2023
Professionelle Fotografen und Videofilmer
Die spiegellose Kamerareihe Alpha erwirtschaftete im Jahr 2023 einen Umsatz von 1,8 Milliarden US-Dollar im professionellen Bereich.
| Kamerasegment | Marktanteil |
|---|---|
| Professionelle spiegellose Kameras | 18.5% |
| Professionelle Videoausrüstung | 22.3% |
Konsumenten von Unterhaltungsinhalten
Sony Entertainment erzielte im Jahr 2023 einen Medien- und Streaming-Umsatz von 9,6 Milliarden US-Dollar.
- PlayStation Plus-Abonnenten: 47,3 Millionen aktive Benutzer
- Anime-Streaming-Plattform Crunchyroll: 5,4 Millionen zahlende Abonnenten
Märkte für Unternehmens- und Halbleitertechnologie
Sony Semiconductor Solutions erzielte im Geschäftsjahr 2023 einen Umsatz von 12,3 Milliarden US-Dollar.
| Halbleitersegment | Einnahmen |
|---|---|
| Bildsensoren | 8,7 Milliarden US-Dollar |
| Automobilelektronik | 2,1 Milliarden US-Dollar |
| Industrielle Lösungen | 1,5 Milliarden US-Dollar |
Sony Group Corporation (SONY) – Geschäftsmodell: Kostenstruktur
Hohe F&E-Investitionen
Sony investierte im Geschäftsjahr 2023 769,4 Milliarden Yen (ca. 5,5 Milliarden US-Dollar) in Forschungs- und Entwicklungskosten. Die Aufteilung der F&E-Investitionen auf die Geschäftsbereiche:
| Geschäftssegment | F&E-Investitionen (Milliarden Yen) |
|---|---|
| 378.2 | |
| 251.6 | |
| 139.6 |
Globale Herstellungskosten
Die weltweiten Herstellungskosten von Sony beliefen sich im Jahr 2023 auf etwa 4,2 Billionen Yen, mit bedeutenden Produktionsstätten in:
- Japan
- China
- Malaysia
- Thailand
- Vereinigte Staaten
Marketing- und Werbekosten
Die Marketing- und Werbeausgaben von Sony für das Geschäftsjahr 2023 beliefen sich auf 507,3 Milliarden Yen und verteilten sich auf verschiedene Produktkategorien:
| Produktkategorie | Marketingausgaben (Milliarden Yen) |
|---|---|
| Spielen | 226.5 |
| Elektronik | 168.9 |
| Unterhaltung | 111.9 |
Investitionen in die Content-Produktion
Sony investierte im Jahr 2023 612,8 Milliarden Yen in die Content-Produktion seiner Unterhaltungssparten:
- Sony Pictures Entertainment: 287,4 Milliarden Yen
- Sony Music Entertainment: 189,6 Milliarden Yen
- Anime- und Gaming-Inhalte: ¥ 135,8 Milliarden
Wartung der Technologieinfrastruktur
Die Wartungskosten für die Technologieinfrastruktur beliefen sich für Sony im Jahr 2023 auf 342,6 Milliarden Yen, darunter:
| Kategorie „Infrastruktur“. | Wartungskosten (Milliarden Yen) |
|---|---|
| Rechenzentren | 126.5 |
| Netzwerkinfrastruktur | 98.7 |
| Cloud-Dienste | 117.4 |
Sony Group Corporation (SONY) – Geschäftsmodell: Einnahmequellen
Verkauf von Unterhaltungselektronik
Der Umsatz von Sony mit Unterhaltungselektronik belief sich im Geschäftsjahr 2023 auf insgesamt 8.409 Milliarden Yen. Zu den wichtigsten Produktkategorien gehören:
| Produktkategorie | Umsatz (Milliarden Yen) |
|---|---|
| Audio & Video | 1,243 |
| Kameras | 412 |
| Mobilkommunikation | 541 |
Einnahmen aus PlayStation-Spielen und Konsolen
Das PlayStation-Segment erwirtschaftete im Geschäftsjahr 2023 einen Umsatz von 3.785 Milliarden Yen.
- Kumulierte Verkäufe der PlayStation 5: 40,4 Millionen Einheiten, Stand Dezember 2023
- PlayStation Plus-Abonnement: 47,2 Millionen Abonnenten
- Umsatz mit digitalen Spielen: 1.521 Milliarden Yen
Lizenzierung von Unterhaltungsinhalten
Umsatz von Sony Pictures Entertainment für 2023: 10,1 Milliarden USD
| Inhaltstyp | Umsatz (Milliarden USD) |
|---|---|
| Filmlizenzierung | 4.2 |
| Fernsehlizenzierung | 3.7 |
| Streaming-Rechte | 2.2 |
Vertrieb von Halbleitertechnologie
Umsatz von Sony Semiconductor Solutions: 1.138 Milliarden Yen im Geschäftsjahr 2023
- Umsatz mit Bildsensoren: 839 Milliarden Yen
- Markt für Automobilsensoren: 312 Milliarden Yen
Abonnements für digitale Dienste
Umsatz mit digitalen Diensten auf allen Plattformen: 2.345 Milliarden Yen
| Abonnementdienst | Abonnenten | Umsatz (Milliarden Yen) |
|---|---|---|
| PlayStation Plus | 47,2 Millionen | 812 |
| Sony Music-Abonnements | 22,5 Millionen | 456 |
| PlayStation Now | 16,8 Millionen | 287 |
Sony Group Corporation (SONY) - Canvas Business Model: Value Propositions
You're looking at the core offerings that keep Sony Group Corporation at the center of consumer and professional markets. Honestly, the value they deliver is split across experiences and the foundational technology that powers them.
Immersive Entertainment: High-fidelity gaming and premium music/film content
The Game & Network Services (G&NS) division is a massive draw, showing strong user engagement. For the second quarter of fiscal year 2025, the PlayStation Network recorded 119 million Monthly Active Users. This platform supports hardware sales, with PlayStation 5 lifetime units reaching 84.2 million as of that same quarter, having moved 3.9 million units in Q2 FY2025 alone. Network services revenue is a key growth driver; in Q2 FY2025, G&NS sales were up around 4% year-on-year, reaching ¥1.1 trillion (approximately US $7.1 billion). Subscription value is clear: PlayStation Plus Premium subscriptions grew 9% year-on-year to 23.7 million. Furthermore, the digital ecosystem is maturing, with the full game software digital download ratio hitting 72%.
In Music, the value is in premium content access and creator support. Dollar-based revenue for the Music division saw growth of 7.3% in Q2 FY2025, supported by physical sales up 10.6% and digital downloads up 52%. For Pictures, value comes from established IP; Crunchyroll paid subscribers exceeded 17 million as of March 31, 2025. Standout content like the Netflix hit "KPop Demon Hunters" helped the Pictures division's net income jump 65% in Q1 FY2025.
| Metric | Value (Latest Available) | Period/Context |
| PlayStation Network MAU | 119 million | Q2 FY2025 |
| PlayStation 5 Lifetime Units Sold | 84.2 million | As of Q2 FY2025 |
| PlayStation Plus Premium Subscribers | 23.7 million | As of Q2 FY2025 |
| G&NS Quarterly Sales | ¥1.1 trillion | Q2 FY2025 |
| Crunchyroll Paid Subscribers | Over 17 million | As of March 31, 2025 |
Technological Leadership: Cutting-edge image quality via BRAVIA and Alpha cameras
Sony Group Corporation maintains its lead through high-performance components and premium consumer electronics. The Imaging & Sensing Solutions (I&SS) segment delivered significant financial results for the fiscal year ending March 31, 2025, with sales reaching JPY 1.799 trillion. Operating income for I&SS for that same fiscal year was JPY 261 billion, an increase of JPY 67.6 billion year-on-year. The company's forecast for the calendar year 2025 global image sensor market share by revenue was set at 56%. For consumer electronics under the Entertainment, Technology & Services (ET&S) division, sales for the fiscal year ending March 31, 2025, were JPY 2.409 trillion, with operating income ticking up to JPY 190 billion.
B2B Component Excellence: High-performance image sensors for mobile and automotive
This is where the foundational technology translates into critical B2B value. The I&SS division saw increased unit sales of smartphone image sensors combined with an improved product mix, meaning they sold more of the higher-priced models. The overall segment posted record high sales and operating income for the fiscal year ending March 31, 2025. The company is actively working to build on this, with I&SS growth expected to drive the upward revision to the full-year operating income forecast for FY2025. While the company did not meet its ambitious target of capturing 60% market share by 2025, the 56% forecast for CY2025 still represents a dominant position. The Mobile Communications segment, which is part of ET&S, contributed JPY 279 billion in sales for the fiscal year ending March 31, 2025.
Ecosystem Lock-in: Seamless integration across hardware, software, and network services
The value proposition here is the sticky environment created by connecting hardware to services. The 119 million MAUs on the PlayStation Network in Q2 FY2025 are actively engaged in the ecosystem, which is further evidenced by the 72% digital download ratio for full games. The overall Group saw sales of continuing operations increase 5% year-on-year to ¥3,107.9 billion in Q2 FY2025, with network services revenue being a primary driver. The upward revision to the full-year sales forecast by 3% to ¥12 trillion reflects confidence in this integrated model continuing through the second half of FY2025. The company's strategy is focused on maximizing IP value through diverse collaboration across its segments.
- PSN MAU: 119 million (Q2 FY2025)
- Digital Game Sales Ratio: 72% (Q2 FY2025)
- Group Sales Growth (Continuing Ops): 5% YoY (Q2 FY2025)
- FY2025 Sales Forecast Revision: Up 3%
Creative Tools: Professional-grade cameras and audio equipment for creators
Sony provides tools for professionals, which is reflected in the performance of the ET&S division, which houses still and video cameras and audio equipment. While overall ET&S sales for the fiscal year ending March 31, 2025, saw a slight drop to JPY 2.409 trillion, the operating income still managed to tick up to JPY 190 billion. This suggests that the higher-value, professional-grade equipment sales, which carry better margins, are holding up or improving mix. The overall Group is focused on improving profitability through an accelerated review of low-profit businesses and shifting resources to priority areas, which includes these professional tools.
The Group's overall financial health supports continued investment in these areas; for Q2 FY2025, operating income rose 10% year-on-year to ¥429.0 billion, and the full-year operating income forecast was revised up 8% to ¥1.430 trillion. That financial strength helps fund the R&D needed to keep these creative tools at the forefront.
Finance: draft 13-week cash view by Friday.
Sony Group Corporation (SONY) - Canvas Business Model: Customer Relationships
Direct-to-Consumer (DTC) via PlayStation Network and Crunchyroll subscriptions.
PlayStation Network monthly active users reached 119 million as of September 30, 2025. The average monthly revenue per user (ARPU) on PSN is now $7.96. Total PlayStation Plus subscribers were at 51.6 million across all tiers in Q1 2025. Specifically, PlayStation Plus Premium subscriptions stood at 23.7 million.
For the anime streaming service, Crunchyroll surpassed 17 million paid subscribers as of May 2025. This represents a growth from 5 million subscribers in 2021. The platform is available in over 200 countries.
Sony is building a new engagement platform leveraging core backend functions like payment, data infrastructure, and security from PlayStation Network across various network services within Sony Group for better monetization.
| Metric | Value | Date/Period |
| PSN Monthly Active Users | 119 million | September 30, 2025 |
| PlayStation Plus Total Subscribers | 51.6 million | Q1 2025 |
| PlayStation Plus Premium Subscribers | 23.7 million | Q1 2025 |
| Crunchyroll Paid Subscribers | 17 million | May 2025 |
| PSN ARPU (Monthly) | $7.96 | Early 2025 |
Automated Service: Digital support and community forums for electronics.
The Entertainment, Technology & Services (ET&S) division sells innovative electronics, with a value proposition centered on superior technology enhancing enjoyment of diverse entertainment types. Sony aims to provide timely and efficient customer support to strengthen customer loyalty and retention.
Dedicated Account Management: For B2B clients purchasing image sensors and professional displays.
The Imaging & Sensing Solutions (I&SS) division reported sales of JPY 1.799 trillion for the fiscal year ended March 31, 2025. Operating income for I&SS for that same period rose to JPY 261 billion. Sony's forecast for global image sensor market share by revenue for CY2025 is 56%. For Professional Display Solutions in 2025, the focus includes reinforcing existing relationships with integrators and consultants.
Community Building: Fostering fan engagement around major IP like anime and gaming.
Sony is focused on maximizing IP value through diverse collaboration. For anime, fan communities contributed 51 million votes worldwide for the 2025 Crunchyroll Anime Awards. In gaming, 60% of PlayStation Network users log in weekly. Sony aims to create opportunities by connecting fan communities across various entertainment sectors through its Engagement Platform initiative.
- PlayStation Network users under age 35 accounted for 51% in 2025.
- Women now make up 29% of the PlayStation user base.
- The Crunchyroll library includes more than 25,000 plus hours of anime content.
Sony Group Corporation (SONY) - Canvas Business Model: Channels
You're looking at how Sony Group Corporation gets its products and services into the hands of customers across its diverse portfolio. The channel strategy is a mix of massive digital ecosystems, traditional retail partnerships, and direct-to-consumer touchpoints.
PlayStation Network (PSN) for digital game and network service sales
The PlayStation Network is a core distribution channel, heavily favoring digital transactions. For the Game & Network Services (G&NS) segment in the second quarter of fiscal year 2025 (Q2 FY25), Sales Income reached ¥1.1 trillion (approximately US $7.1 billion), marking an increase of around 4% year-on-year. This growth was driven by network services and software sales.
Digital sales dominance is clear. For Q2 FY25, a significant 83% of full game software sales were digital downloads. In the first quarter of FY25 (Q1 FY25), digital software sales alone hit ¥200 billion ($1.38 billion), a substantial 40.6% year-on-year increase. The platform's reach is measured by its user base, with Monthly Active Users (MAUs) on the PlayStation Network reaching 123 million as of June 2025.
Key metrics for the digital channel in Q2 FY25 include:
- Monthly Active Users (MAUs): 123 million
- Full Game Software Units Sold (PS5/PS4): 65.9 million
- First-Party Software Units: 6.9 million
Direct Online Store for electronics and hardware sales
While specific revenue for the direct online store for electronics isn't broken out, the Entertainment, Technology & Services (ET&S) segment, which includes consumer electronics, posted Sales of ¥614.6 billion in Q2 FY25. Sony's overall strategy for hardware relies on a combination of direct sales and partners, with the company forecasting 18 million PS5 units for the full fiscal year 2025.
Global network of Retail Partners (e.g., Best Buy, Amazon)
Retail partners are essential for hardware placement and physical software sales. The PlayStation 5 hardware sales are heavily reliant on this channel. Lifetime PS5 console sales surpassed 80.3 million units globally as of June 30, 2025. For Q2 FY25, Sony shipped 2.5 million PS5 units during the quarter. Physical software revenue recognition is lower for Sony as they primarily recognize royalties from third-party sales, but physical games still accounted for 24% of overall PlayStation game sales in 2024.
Here's a look at the G&NS segment channel performance context:
| Metric | Latest Reported Figure (Q2 FY25 or most recent) | Comparison/Context |
| G&NS Sales Income | ¥1.1 trillion (Q2 FY25) | Up around 4% YoY |
| PS5 Units Shipped (FY2025 Forecast) | 18 million units | Full Fiscal Year ending March 2026 |
| PS5 Units Shipped (Q2 FY25) | 2.5 million units | During the quarter |
| Digital Software Sales Ratio | 83% | Of full game software sales in Q2 FY25 |
| Physical Software Sales Revenue Share (2024) | 3% (Reported by Sony) | Analyst noted physical games made up 24% of overall sales volume |
Sony Stores (physical and online) for premium product experience
The dedicated Sony Stores serve as flagship locations for experiencing premium products, though their direct revenue contribution is aggregated within the larger segments. The ET&S segment, which houses these retail experiences, posted an operating income of ¥61.0 billion in Q2 FY25. This channel supports the brand image for high-end electronics and the PlayStation ecosystem.
Film/Music Distribution via theaters, streaming platforms, and record labels
Distribution for content is highly segmented. The Music segment saw robust growth in Q2 FY25, with sales increasing 21% year-on-year and operating income up 28%. This was fueled by streaming and Visual Media and Platform revenue, which saw recorded music streaming revenue rise 12% and music publishing streaming revenue rise 25% (on a USD basis) in Q2 FY25. The full-year sales forecast for Music was revised up 6% to ¥1.980 trillion.
Conversely, the Pictures segment faced headwinds in Q2 FY25. Sales decreased 3% year-on-year, mainly due to lower theatrical release sales compared to a strong prior period. Operating income for Pictures dropped 25% in the same quarter. Crunchyroll sales provided some offset to the decline.
Distribution channel highlights for Content segments (Q2 FY25):
- Music Sales Growth: 21% year-on-year
- Music Operating Income Growth: 28% year-on-year
- Pictures Sales Change: -3% year-on-year
- Pictures Operating Income Change: -25% year-on-year
Sony Group Corporation (SONY) - Canvas Business Model: Customer Segments
You're looking at the core customer groups that drive the current financial performance for Sony Group Corporation as of late 2025. The data from the second quarter of fiscal year 2025, ending September 30, 2025, gives us a clear picture of where the money is coming from.
The sheer scale of the consumer base is best seen when you look at the segment results. Here's the quick math on the Q2 FY2025 performance for the key revenue-generating segments:
| Segment | Q2 FY2025 Sales (Bln Yen) | Q2 FY2025 Operating Income (Bln Yen) |
| Game & Network Services (G&NS) | 1,113.2 | 120.4 |
| Music | 448.2 | 90.4 |
| Imaging & Sensing Solutions (I&SS) | 614.6 | 138.3 |
| Entertainment, Technology & Services (ET&S) | 575.7 | 13.9 |
This table shows the Imaging & Sensing Solutions (I&SS) segment delivered the highest operating income for the quarter at ¥138.3 billion, even beating the Game & Network Services (G&NS) segment's ¥120.4 billion.
Gamers/Entertainment Seekers: Consumers of PlayStation, movies, and music content.
This group is anchored by the massive reach of the PlayStation ecosystem. Monthly Active Users (MAUs) across all of PS reached 119 million accounts as of September 2025. The G&NS segment posted sales of ¥1.1 trillion for the quarter, with 80.3 million full game software units sold.
- PlayStation 5 installed base reached 84.2 million units as of Q2 FY2025.
- The digital download ratio for full game software (PS4/PS5) is at 72%.
- PlayStation Plus Premium subscriptions reached 23.7 million in early 2025.
- The Music segment, serving music fans, recorded sales of ¥448.2 billion in Q2 FY2025.
- The Pictures segment, covering movies and TV, had Q2 FY2025 sales of ¥346.0 billion.
The music business shows steady growth, with streaming revenue for recorded music increasing 5% and music publishing increasing 6% year-on-year on a U.S. dollar basis for the quarter.
Tech Enthusiasts/Creatives: Professionals and hobbyists buying Alpha cameras and high-end audio.
These customers are primarily served through the Entertainment, Technology & Services (ET&S) segment, which includes consumer electronics like cameras and audio gear. The ET&S segment generated sales of ¥575.7 billion in the second quarter of fiscal year 2025.
- The segment's operating income for the quarter was ¥13.9 billion.
- The strength in professional digital cameras is noted as a key driver contributing to the success of the I&SS segment's profit, even though the camera hardware itself is booked in ET&S.
What this estimate hides is the specific revenue split between high-end cameras and high-end audio within the ET&S total.
Mobile/Automotive Manufacturers: B2B clients purchasing image sensors (I&SS segment).
This is a critical B2B segment, where Sony is the market leader in image sensors for mobile devices and increasingly for automotive applications. The I&SS segment sales for Q2 FY2025 were ¥614.6 billion, a significant jump from the ¥535.6 billion in sales reported for the same quarter in the prior fiscal year (FY2024). Operating income for I&SS in Q2 FY2025 hit ¥138.3 billion, up from ¥92.4 billion in Q2 FY2024.
- Sony forecasts a 56% global image sensor market share by revenue for CY2025.
- Growth was driven by increased unit sales of smartphone image sensors and an improved product mix (selling more pricey models).
- The segment's ROIC forecast for FY2025 is 10.4%.
This division is definitely the most profitable part of Sony in this quarter, even beating G&NS's operating income on paper.
Corporate/Education/Retail: B2B buyers of professional displays and AV solutions.
These professional clients are also served through the ET&S segment, which includes Professional Products & Solutions. The segment's Q2 FY2025 sales were ¥575.7 billion, with an operating income of ¥13.9 billion. This group buys high-end professional displays and AV equipment for corporate installations, broadcast, and educational facilities.
- The ET&S segment's operating income for the quarter was ¥13.9 billion.
Finance: draft 13-week cash view by Friday.
Sony Group Corporation (SONY) - Canvas Business Model: Cost Structure
You're looking at the major outflows for Sony Group Corporation as of late 2025, which shows where the bulk of their operational cash goes to keep the whole machine running. It's a mix of making physical things, creating digital content, and heavy investment in future tech.
The single largest cost component is the Cost of Sales, which hit ¥8,504.8 billion for the fiscal year ending March 31, 2025. This figure primarily covers the direct costs associated with manufacturing hardware and producing the content that drives their revenue streams. To be fair, while this number is huge, the ratio of cost of sales to sales actually improved slightly year-on-year, moving to 70.7%.
To maintain its edge in imaging and sensing, plus game technology, Sony keeps its foot on the gas with Research and Development (R&D). For FY2025, R&D expenses totaled ¥734.6 billion. Honestly, this R&D spend is baked right into the Cost of Sales, and it represented 6.1% of sales for the year.
The necessary overhead to sell and manage this global operation is substantial. Selling, General and Administrative (SGA) Expenses for FY2025 were reported at ¥2,256.8 billion, marking a year-on-year increase of ¥100.7 billion. This ratio to sales improved slightly to 18.8%.
Investment in future capacity, particularly for semiconductors, is a major capital outlay. Capital Expenditures for the fiscal year ending March 2025 totaled $4.318 billion. This represents a 4.7% increase over the prior year.
Content creation is a massive, ongoing cost, especially for the entertainment segments. While a single total for Content Acquisition Costs isn't explicitly broken out, the structure includes significant spending on:
- Content production capitalized as deferred film production costs.
- Acquisition of TV broadcasting rights and digital distribution rights.
- Internally developed game content and master recordings included in Content assets.
Here's a quick look at how the main cost categories stack up for the fiscal year ended March 31, 2025, based on the consolidated financial data:
| Cost Category | Amount (Billions of JPY) | Notes |
| Cost of Sales | 8,504.8 | Primary cost for manufacturing and content production. |
| Selling, General and Administrative Expenses (SGA) | 2,256.8 | Increased by 100.7 billion JPY year-on-year. |
| R&D Costs (Included in Cost of Sales) | 734.6 | Maintained tech leadership efforts. |
You can see the scale of the operation just by looking at the total costs. For context, the total costs and expenses for the fiscal year ended March 31, 2025, were ¥2,423,866 million (or ¥2,423.9 billion) on a basis that excludes the Financial Services business (which was reclassified as discontinued operations for comparison).
Finance: draft the 13-week cash flow view incorporating the Q3 FY2025 actuals by Friday.
Sony Group Corporation (SONY) - Canvas Business Model: Revenue Streams
You're looking at the hard numbers for Sony Group Corporation's revenue engine as of late 2025. Honestly, the story is in the mix, with technology sales underpinning massive entertainment revenue streams.
FY2025 Consolidated Sales reached ¥12,957.1 billion for the fiscal year ended March 31, 2025. This massive top line is built from several distinct, powerful segments.
Here is a look at the revenue generation across the key business areas, using the latest available quarterly data from Q2 FY2025 (the quarter ended September 30, 2025) for segment detail, alongside the full-year actual:
| Revenue Stream Segment | Q2 FY2025 Sales (Billions of Yen) | Key Driver/Context |
| Game and Network Services (G&NS) | ¥1,113.2 billion | Sales of consoles, software, and PS Plus subscriptions. |
| Imaging & Sensing Solutions (I&SS) | ¥614.6 billion | Sales of image sensors to external manufacturers. |
| Electronics Products & Solutions (EP&S) (Reported as ET&S) | ¥575.7 billion | Sales of TVs, cameras, and audio equipment. |
| Music | ¥542.4 billion | Recorded music, music publishing, and visual media platform revenue. |
| Pictures | ¥346.0 billion | Theatrical, home entertainment, and television production/licensing revenue. |
The G&NS segment shows strong recurring revenue growth. For instance, in Q1 FY2025, network services revenue, which includes PS Plus, was up 8.3% year-on-year. Game software sales overall saw an 11% jump in that same quarter.
For the Music segment, the FY ended March 31, 2025, saw sales reach ¥1,842.6 billion, a year-on-year increase of ¥223.6 billion. This was fueled by streaming, where recorded music revenue increased 7% and music publishing revenue increased 8% in Q1 FY2025.
The I&SS segment is a high-margin powerhouse. Its operating income exploded by 50% in Q2 FY2025, making it a single biggest reason for Sony's blockbuster results that quarter.
You can see the subscription base is growing, which is key for predictable revenue:
- Monthly active users across all PlayStation platforms increased 6% year-on-year to 123 million as of June 2025.
The Pictures segment shows resilience through varied distribution. In Q1 FY2025, sales were down 3% year-on-year, but operating income increased 65%, primarily due to higher television production deliveries.
The Electronics Products & Solutions segment (labeled ET&S in the Q2 data) saw sales decrease 11% year-on-year in Q1 FY2025, largely due to lower TV unit sales and foreign exchange impact. Still, the segment generated ¥575.7 billion in sales in Q2 FY2025.
Finance: draft 13-week cash view by Friday.
Disclaimer
All information, articles, and product details provided on this website are for general informational and educational purposes only. We do not claim any ownership over, nor do we intend to infringe upon, any trademarks, copyrights, logos, brand names, or other intellectual property mentioned or depicted on this site. Such intellectual property remains the property of its respective owners, and any references here are made solely for identification or informational purposes, without implying any affiliation, endorsement, or partnership.
We make no representations or warranties, express or implied, regarding the accuracy, completeness, or suitability of any content or products presented. Nothing on this website should be construed as legal, tax, investment, financial, medical, or other professional advice. In addition, no part of this site—including articles or product references—constitutes a solicitation, recommendation, endorsement, advertisement, or offer to buy or sell any securities, franchises, or other financial instruments, particularly in jurisdictions where such activity would be unlawful.
All content is of a general nature and may not address the specific circumstances of any individual or entity. It is not a substitute for professional advice or services. Any actions you take based on the information provided here are strictly at your own risk. You accept full responsibility for any decisions or outcomes arising from your use of this website and agree to release us from any liability in connection with your use of, or reliance upon, the content or products found herein.