
|
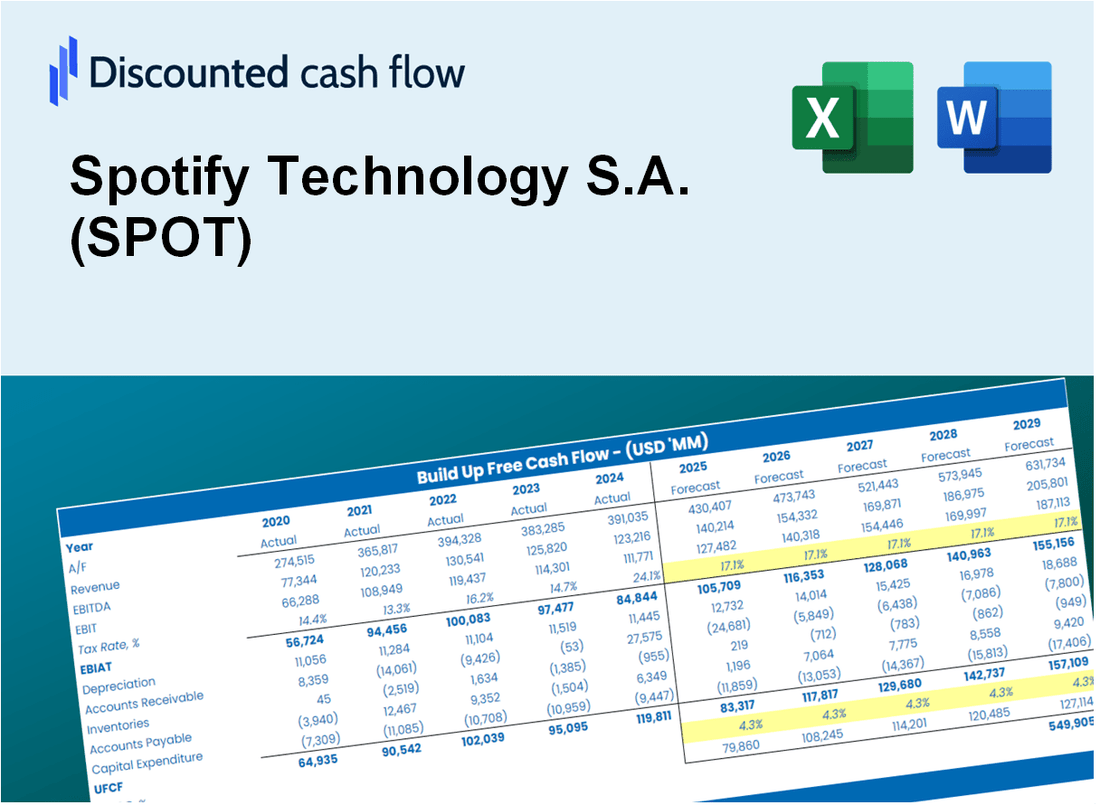
Spotify -Technologie S.A. (Spot) DCF -Bewertung |
Fully Editable: Tailor To Your Needs In Excel Or Sheets
Professional Design: Trusted, Industry-Standard Templates
Investor-Approved Valuation Models
MAC/PC Compatible, Fully Unlocked
No Expertise Is Needed; Easy To Follow
Spotify Technology S.A. (SPOT) Bundle
Verbessern Sie Ihre Anlagestrategien mit dem Spotify (Spot) DCF -Taschenrechner! Verwenden Sie authentische Spotify -Finanzdaten, passen Sie Wachstumsprojektionen und -kosten an und beobachten Sie sofort, wie sich diese Veränderungen auf den inneren Wert von Spotify (Spot) auswirken.
Discounted Cash Flow (DCF) - (USD MM)
| Year | AY1 2020 |
AY2 2021 |
AY3 2022 |
AY4 2023 |
AY5 2024 |
FY1 2025 |
FY2 2026 |
FY3 2027 |
FY4 2028 |
FY5 2029 |
|---|---|---|---|---|---|---|---|---|---|---|
| Revenue | 9,304.5 | 11,415.8 | 13,847.0 | 15,641.8 | 18,506.3 | 21,988.4 | 26,125.7 | 31,041.4 | 36,882.0 | 43,821.6 |
| Revenue Growth, % | 0 | 22.69 | 21.3 | 12.96 | 18.31 | 18.82 | 18.82 | 18.82 | 18.82 | 18.82 |
| EBITDA | -642.3 | 491.2 | -186.6 | -364.9 | 1,768.8 | 144.1 | 171.2 | 203.5 | 241.7 | 287.2 |
| EBITDA, % | -6.9 | 4.3 | -1.35 | -2.33 | 9.56 | 0.65544 | 0.65544 | 0.65544 | 0.65544 | 0.65544 |
| Depreciation | 131.1 | 150.0 | 201.9 | 186.6 | 142.9 | 270.2 | 321.1 | 381.5 | 453.3 | 538.6 |
| Depreciation, % | 1.41 | 1.31 | 1.46 | 1.19 | 0.77203 | 1.23 | 1.23 | 1.23 | 1.23 | 1.23 |
| EBIT | -773.4 | 341.2 | -388.5 | -551.4 | 1,625.9 | -126.1 | -149.9 | -178.1 | -211.6 | -251.4 |
| EBIT, % | -8.31 | 2.99 | -2.81 | -3.53 | 8.79 | -0.57359 | -0.57359 | -0.57359 | -0.57359 | -0.57359 |
| Total Cash | 2,060.2 | 4,145.0 | 3,923.0 | 4,994.7 | 8,794.3 | 7,310.5 | 8,686.0 | 10,320.3 | 12,262.2 | 14,569.4 |
| Total Cash, percent | .0 | .0 | .0 | .0 | .0 | .0 | .0 | .0 | .0 | .0 |
| Account Receivables | 551.9 | 741.4 | 813.9 | 1,040.7 | 943.4 | 1,321.7 | 1,570.4 | 1,865.9 | 2,216.9 | 2,634.1 |
| Account Receivables, % | 5.93 | 6.49 | 5.88 | 6.65 | 5.1 | 6.01 | 6.01 | 6.01 | 6.01 | 6.01 |
| Inventories | .0 | .0 | .0 | .0 | .0 | .0 | .0 | .0 | .0 | .0 |
| Inventories, % | 0 | 0 | 0 | 0 | 0 | 0 | 0 | 0 | 0 | 0 |
| Accounts Payable | 511.8 | 632.4 | 688.6 | 784.6 | 1,101.6 | 1,186.6 | 1,409.9 | 1,675.1 | 1,990.3 | 2,364.8 |
| Accounts Payable, % | 5.5 | 5.54 | 4.97 | 5.02 | 5.95 | 5.4 | 5.4 | 5.4 | 5.4 | 5.4 |
| Capital Expenditure | -92.1 | -100.4 | -29.5 | -7.1 | -20.1 | -98.3 | -116.8 | -138.8 | -164.9 | -196.0 |
| Capital Expenditure, % | -0.98985 | -0.87919 | -0.21318 | -0.04529327 | -0.10847 | -0.4472 | -0.4472 | -0.4472 | -0.4472 | -0.4472 |
| Tax Rate, % | 15.14 | 15.14 | 15.14 | 15.14 | 15.14 | 15.14 | 15.14 | 15.14 | 15.14 | 15.14 |
| EBITAT | -633.8 | -46.6 | -451.5 | -580.9 | 1,379.8 | -92.5 | -109.9 | -130.6 | -155.2 | -184.4 |
| Depreciation | ||||||||||
| Changes in Account Receivables | ||||||||||
| Changes in Inventories | ||||||||||
| Changes in Accounts Payable | ||||||||||
| Capital Expenditure | ||||||||||
| UFCF | -634.9 | -65.9 | -295.4 | -532.1 | 1,916.8 | -213.9 | 68.9 | 81.9 | 97.3 | 115.6 |
| WACC, % | 11.35 | 11.3 | 11.36 | 11.36 | 11.35 | 11.34 | 11.34 | 11.34 | 11.34 | 11.34 |
| PV UFCF | ||||||||||
| SUM PV UFCF | 53.6 | |||||||||
| Long Term Growth Rate, % | 4.00 | |||||||||
| Free cash flow (T + 1) | 120 | |||||||||
| Terminal Value | 1,637 | |||||||||
| Present Terminal Value | 957 | |||||||||
| Enterprise Value | 1,010 | |||||||||
| Net Debt | -3,283 | |||||||||
| Equity Value | 4,293 | |||||||||
| Diluted Shares Outstanding, MM | 207 | |||||||||
| Equity Value Per Share | 20.74 |
What You Will Get
- Real SPOT Financials: Includes historical and forecasted data for precise valuation.
- Customizable Inputs: Adjust WACC, tax rates, revenue growth, and capital expenditures as needed.
- Dynamic Calculations: Intrinsic value and NPV are computed automatically.
- Scenario Analysis: Explore various scenarios to assess Spotify’s future performance.
- User-Friendly Design: Designed for professionals while remaining accessible to newcomers.
Key Features
- Customizable Streaming Metrics: Adjust key variables such as subscriber growth, ARPU, and content costs.
- Instant Valuation Insights: Generates intrinsic value, NPV, and other financial metrics in real-time.
- Industry-Leading Precision: Leverages Spotify’s actual financial data for accurate valuation results.
- Effortless Scenario Planning: Explore various assumptions and easily compare different outcomes.
- Efficiency Booster: Avoid the hassle of creating intricate valuation models from the ground up.
How It Works
- Step 1: Download the prebuilt Excel template featuring Spotify's data.
- Step 2: Review the pre-filled sheets to familiarize yourself with the key metrics.
- Step 3: Modify forecasts and assumptions in the editable yellow cells (WACC, growth, margins).
- Step 4: Instantly see the recalculated results, including Spotify's intrinsic value.
- Step 5: Use the outputs to make informed investment decisions or create reports.
Why Choose This Calculator for Spotify Technology S.A. (SPOT)?
- User-Friendly Interface: Perfect for both novices and seasoned professionals.
- Customizable Inputs: Adjust parameters to suit your specific analysis needs.
- Real-Time Updates: Watch Spotify's valuation change instantly as you modify inputs.
- Pre-Loaded Data: Comes with Spotify’s latest financial information for immediate assessment.
- Relied Upon by Experts: Favored by investors and analysts for making strategic decisions.
Who Should Use This Product?
- Music Industry Students: Explore market analysis techniques and apply them to real-time data.
- Researchers: Integrate industry-specific models into academic projects or studies.
- Investors: Validate your investment strategies and assess valuation scenarios for Spotify Technology S.A. (SPOT).
- Market Analysts: Enhance your analysis process with a ready-to-use, customizable financial model.
- Entrepreneurs: Discover how major players like Spotify are evaluated in the market.
What the Template Contains
- Historical Data: Includes Spotify’s past financials and baseline forecasts.
- DCF and Levered DCF Models: Detailed templates to calculate Spotify’s intrinsic value.
- WACC Sheet: Pre-built calculations for Weighted Average Cost of Capital.
- Editable Inputs: Modify key drivers like growth rates, EBITDA %, and CAPEX assumptions.
- Quarterly and Annual Statements: A complete breakdown of Spotify’s financials.
- Interactive Dashboard: Visualize valuation results and projections dynamically.
Disclaimer
All information, articles, and product details provided on this website are for general informational and educational purposes only. We do not claim any ownership over, nor do we intend to infringe upon, any trademarks, copyrights, logos, brand names, or other intellectual property mentioned or depicted on this site. Such intellectual property remains the property of its respective owners, and any references here are made solely for identification or informational purposes, without implying any affiliation, endorsement, or partnership.
We make no representations or warranties, express or implied, regarding the accuracy, completeness, or suitability of any content or products presented. Nothing on this website should be construed as legal, tax, investment, financial, medical, or other professional advice. In addition, no part of this site—including articles or product references—constitutes a solicitation, recommendation, endorsement, advertisement, or offer to buy or sell any securities, franchises, or other financial instruments, particularly in jurisdictions where such activity would be unlawful.
All content is of a general nature and may not address the specific circumstances of any individual or entity. It is not a substitute for professional advice or services. Any actions you take based on the information provided here are strictly at your own risk. You accept full responsibility for any decisions or outcomes arising from your use of this website and agree to release us from any liability in connection with your use of, or reliance upon, the content or products found herein.