
|
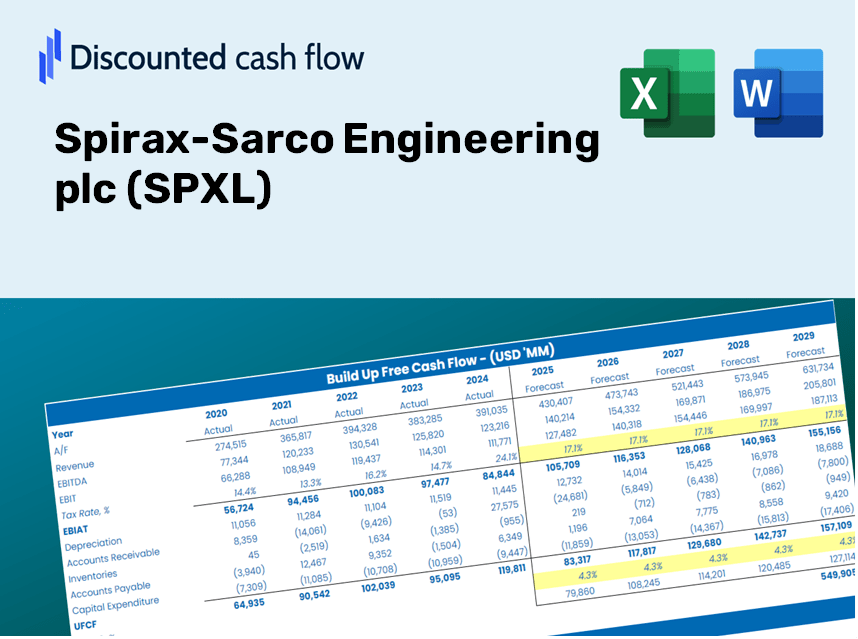
Spirax-Sarco Engineering Plc (SPX.L) DCF-Bewertung |
Fully Editable: Tailor To Your Needs In Excel Or Sheets
Professional Design: Trusted, Industry-Standard Templates
Investor-Approved Valuation Models
MAC/PC Compatible, Fully Unlocked
No Expertise Is Needed; Easy To Follow
Spirax-Sarco Engineering plc (SPX.L) Bundle
Verbessern Sie Ihre Investitionsauswahl mit dem DCF-Taschenrechner des Spirax-Sarco Engineering Plc (SPXL)! Überprüfen Sie die tatsächlichen Finanzdaten, passen Sie Wachstumsprognosen und -kosten an und beobachten Sie, wie sich diese Veränderungen in Echtzeit auf den inneren Wert der Spirax-Sarco Engineering PLC (SPXL) auswirken.
Discounted Cash Flow (DCF) - (USD MM)
| Year | AY1 2020 |
AY2 2021 |
AY3 2022 |
AY4 2023 |
AY5 2024 |
FY1 2025 |
FY2 2026 |
FY3 2027 |
FY4 2028 |
FY5 2029 |
|---|---|---|---|---|---|---|---|---|---|---|
| Revenue | 1,193.4 | 1,344.5 | 1,610.6 | 1,682.6 | 1,665.2 | 1,814.6 | 1,977.4 | 2,154.8 | 2,348.2 | 2,558.9 |
| Revenue Growth, % | 0 | 12.66 | 19.79 | 4.47 | -1.03 | 8.97 | 8.97 | 8.97 | 8.97 | 8.97 |
| EBITDA | 324.3 | 392.0 | 402.1 | 390.6 | 378.3 | 461.7 | 503.2 | 548.3 | 597.5 | 651.1 |
| EBITDA, % | 27.17 | 29.16 | 24.97 | 23.21 | 22.72 | 25.45 | 25.45 | 25.45 | 25.45 | 25.45 |
| Depreciation | 75.4 | 69.0 | 78.5 | 97.0 | 80.4 | 97.7 | 106.5 | 116.0 | 126.4 | 137.8 |
| Depreciation, % | 6.32 | 5.13 | 4.87 | 5.76 | 4.83 | 5.38 | 5.38 | 5.38 | 5.38 | 5.38 |
| EBIT | 248.9 | 323.0 | 323.6 | 293.6 | 297.9 | 364.1 | 396.7 | 432.3 | 471.1 | 513.4 |
| EBIT, % | 20.86 | 24.02 | 20.09 | 17.45 | 17.89 | 20.06 | 20.06 | 20.06 | 20.06 | 20.06 |
| Total Cash | 246.2 | 274.6 | 328.9 | 359.7 | 334.2 | 373.5 | 407.0 | 443.6 | 483.4 | 526.7 |
| Total Cash, percent | .0 | .0 | .0 | .0 | .0 | .0 | .0 | .0 | .0 | .0 |
| Account Receivables | 253.6 | 298.1 | 395.2 | 316.8 | 341.1 | 389.3 | 424.2 | 462.3 | 503.8 | 549.0 |
| Account Receivables, % | 21.25 | 22.17 | 24.54 | 18.83 | 20.48 | 21.45 | 21.45 | 21.45 | 21.45 | 21.45 |
| Inventories | 180.1 | 201.3 | 290.0 | 285.2 | 253.2 | 291.2 | 317.3 | 345.7 | 376.8 | 410.6 |
| Inventories, % | 15.09 | 14.97 | 18.01 | 16.95 | 15.21 | 16.04 | 16.04 | 16.04 | 16.04 | 16.04 |
| Accounts Payable | 45.6 | 67.8 | 89.9 | 79.2 | 86.0 | 88.3 | 96.2 | 104.8 | 114.2 | 124.4 |
| Accounts Payable, % | 3.82 | 5.04 | 5.58 | 4.71 | 5.16 | 4.86 | 4.86 | 4.86 | 4.86 | 4.86 |
| Capital Expenditure | -49.6 | -64.1 | -117.5 | -105.4 | -74.3 | -97.8 | -106.6 | -116.1 | -126.5 | -137.9 |
| Capital Expenditure, % | -4.16 | -4.77 | -7.3 | -6.26 | -4.46 | -5.39 | -5.39 | -5.39 | -5.39 | -5.39 |
| Tax Rate, % | 26.15 | 26.15 | 26.15 | 26.15 | 26.15 | 26.15 | 26.15 | 26.15 | 26.15 | 26.15 |
| EBITAT | 179.8 | 240.9 | 236.0 | 220.5 | 220.0 | 268.5 | 292.5 | 318.8 | 347.4 | 378.6 |
| Depreciation | ||||||||||
| Changes in Account Receivables | ||||||||||
| Changes in Inventories | ||||||||||
| Changes in Accounts Payable | ||||||||||
| Capital Expenditure | ||||||||||
| UFCF | -182.5 | 202.3 | 33.3 | 284.6 | 240.6 | 184.4 | 239.3 | 260.8 | 284.2 | 309.7 |
| WACC, % | 8.04 | 8.06 | 8.04 | 8.06 | 8.05 | 8.05 | 8.05 | 8.05 | 8.05 | 8.05 |
| PV UFCF | ||||||||||
| SUM PV UFCF | 1,001.2 | |||||||||
| Long Term Growth Rate, % | 4.00 | |||||||||
| Free cash flow (T + 1) | 322 | |||||||||
| Terminal Value | 7,953 | |||||||||
| Present Terminal Value | 5,400 | |||||||||
| Enterprise Value | 6,401 | |||||||||
| Net Debt | 691 | |||||||||
| Equity Value | 5,710 | |||||||||
| Diluted Shares Outstanding, MM | 74 | |||||||||
| Equity Value Per Share | 7,726.72 |
What You Will Receive
- Pre-Filled Financial Model: Leveraging Spirax-Sarco's actual data for accurate DCF valuation.
- Comprehensive Forecast Control: Customize revenue growth, profit margins, WACC, and other essential metrics.
- Real-Time Calculations: Immediate updates allow you to view outcomes as you adjust inputs.
- Investor-Ready Template: A polished Excel file crafted for high-quality valuation analysis.
- Flexible and Reusable: Designed for versatility, enabling repeated use for in-depth forecasting.
Key Features
- Comprehensive DCF Calculator: Offers detailed unlevered and levered DCF valuation models tailored for Spirax-Sarco Engineering plc (SPXL).
- WACC Calculator: Features a pre-configured Weighted Average Cost of Capital sheet with customizable input parameters.
- Adjustable Forecast Assumptions: Easily modify growth rates, capital expenditures, and discount rates as needed.
- Integrated Financial Ratios: Evaluate profitability, leverage, and efficiency ratios specifically for Spirax-Sarco Engineering plc (SPXL).
- Dashboard and Visualizations: Provides visual representations that summarize key valuation metrics for straightforward analysis.
How It Functions
- Download the Template: Gain immediate access to the Excel-based SPXL DCF Calculator.
- Input Your Assumptions: Modify the yellow-highlighted cells for growth rates, WACC, margins, and additional inputs.
- Instant Calculations: The model automatically recalculates the intrinsic value of Spirax-Sarco Engineering.
- Test Scenarios: Experiment with various assumptions to assess potential changes in valuation.
- Analyze and Decide: Leverage the results to inform your investment or financial analysis.
Why Opt for This Calculator?
- Reliable Data: Access to authentic Spirax-Sarco Engineering plc (SPXL) financials guarantees trustworthy valuation outcomes.
- Fully Customizable: Modify essential parameters such as growth rates, WACC, and tax rates to align with your forecasts.
- Time-Efficient: Pre-set calculations streamline the process, eliminating the need for repetitive setups.
- Professional Quality Tool: Tailored for investors, analysts, and consultants alike.
- User-Friendly Design: An intuitive interface and detailed guidance ensure ease of use for everyone.
Who Can Benefit from This Product?
- Engineering Students: Master valuation methods and apply them with actual case studies.
- Researchers: Utilize industry-standard models in your academic projects and publications.
- Investors: Evaluate your investment theories and analyze valuation results for Spirax-Sarco Engineering plc (SPXL).
- Market Analysts: Enhance your efficiency with a customizable DCF model designed for your specific needs.
- Entrepreneurs: Discover how major public firms like Spirax-Sarco are assessed in the market.
What the Template Includes
- Historical Data: Contains Spirax-Sarco Engineering plc's (SPXL) previous financial information and foundational forecasts.
- DCF and Levered DCF Models: Comprehensive templates designed to assess the intrinsic value of Spirax-Sarco Engineering plc (SPXL).
- WACC Sheet: Pre-calculated metrics for the Weighted Average Cost of Capital.
- Editable Inputs: Customize key parameters such as growth rates, EBITDA margins, and capital expenditure assumptions.
- Quarterly and Annual Statements: An exhaustive analysis of Spirax-Sarco Engineering plc's (SPXL) financial performance.
- Interactive Dashboard: Dynamically visualize valuation results and future projections.
Disclaimer
All information, articles, and product details provided on this website are for general informational and educational purposes only. We do not claim any ownership over, nor do we intend to infringe upon, any trademarks, copyrights, logos, brand names, or other intellectual property mentioned or depicted on this site. Such intellectual property remains the property of its respective owners, and any references here are made solely for identification or informational purposes, without implying any affiliation, endorsement, or partnership.
We make no representations or warranties, express or implied, regarding the accuracy, completeness, or suitability of any content or products presented. Nothing on this website should be construed as legal, tax, investment, financial, medical, or other professional advice. In addition, no part of this site—including articles or product references—constitutes a solicitation, recommendation, endorsement, advertisement, or offer to buy or sell any securities, franchises, or other financial instruments, particularly in jurisdictions where such activity would be unlawful.
All content is of a general nature and may not address the specific circumstances of any individual or entity. It is not a substitute for professional advice or services. Any actions you take based on the information provided here are strictly at your own risk. You accept full responsibility for any decisions or outcomes arising from your use of this website and agree to release us from any liability in connection with your use of, or reliance upon, the content or products found herein.