
|
Sarepta Therapeutics, Inc. (SRPT) DCF -Bewertung |
Fully Editable: Tailor To Your Needs In Excel Or Sheets
Professional Design: Trusted, Industry-Standard Templates
Investor-Approved Valuation Models
MAC/PC Compatible, Fully Unlocked
No Expertise Is Needed; Easy To Follow
Sarepta Therapeutics, Inc. (SRPT) Bundle
Stürzen Sie Ihre Analyse und verbessern Sie die Präzision mit unserem [SRPT] DCF -Taschenrechner! Mit aktuellen Daten von Sarepta Therapeutics und anpassbaren Annahmen ermöglichen dieses Tool Sie, Sarepta-Therapeutika wie ein erfahrener Investor zu prognostizieren, zu bewerten und zu bewerten.
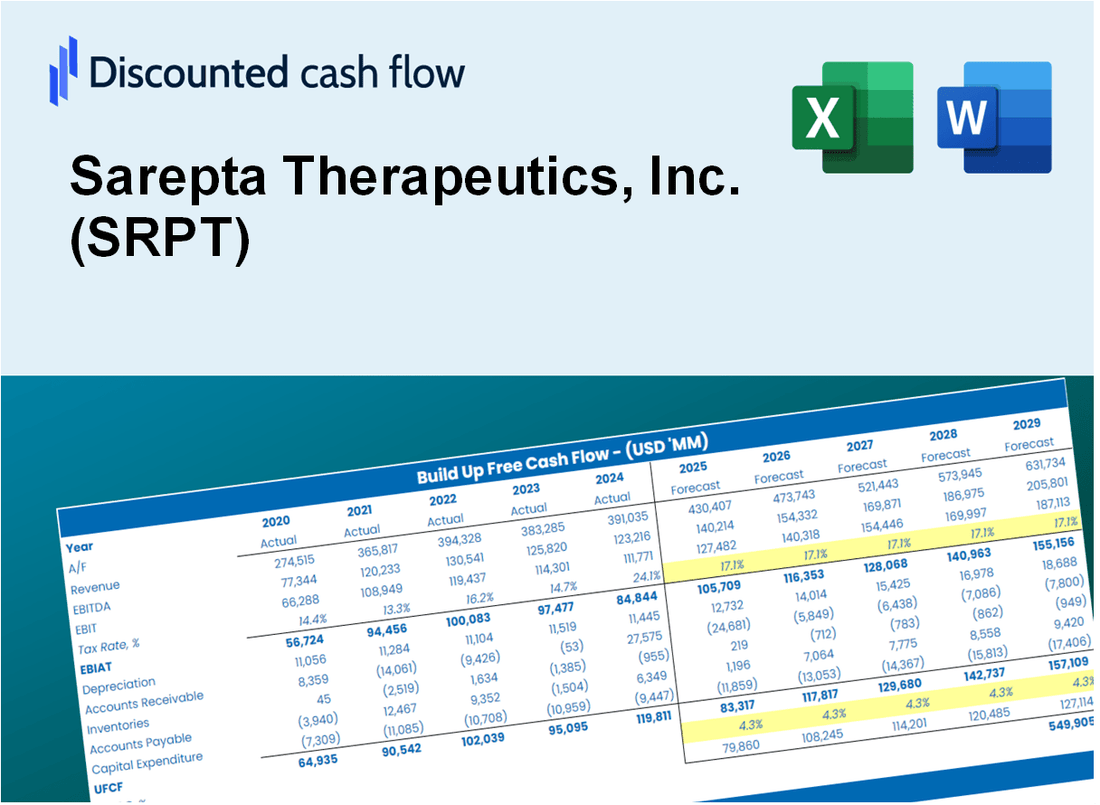
Discounted Cash Flow (DCF) - (USD MM)
| Year | AY1 2020 |
AY2 2021 |
AY3 2022 |
AY4 2023 |
AY5 2024 |
FY1 2025 |
FY2 2026 |
FY3 2027 |
FY4 2028 |
FY5 2029 |
|---|---|---|---|---|---|---|---|---|---|---|
| Revenue | 540.1 | 701.9 | 933.0 | 1,243.3 | 1,902.0 | 2,611.0 | 3,584.4 | 4,920.7 | 6,755.1 | 9,273.4 |
| Revenue Growth, % | 0 | 29.96 | 32.93 | 33.26 | 52.97 | 37.28 | 37.28 | 37.28 | 37.28 | 37.28 |
| EBITDA | -453.4 | -317.4 | -582.1 | -439.2 | 333.1 | -1,093.3 | -1,500.9 | -2,060.5 | -2,828.6 | -3,883.1 |
| EBITDA, % | -83.94 | -45.22 | -62.39 | -35.32 | 17.51 | -41.87 | -41.87 | -41.87 | -41.87 | -41.87 |
| Depreciation | 39.7 | 38.0 | 54.6 | 58.9 | 53.9 | 136.8 | 187.8 | 257.8 | 353.9 | 485.9 |
| Depreciation, % | 7.36 | 5.42 | 5.85 | 4.74 | 2.83 | 5.24 | 5.24 | 5.24 | 5.24 | 5.24 |
| EBIT | -493.1 | -355.4 | -636.7 | -498.1 | 279.2 | -1,230.1 | -1,688.7 | -2,318.3 | -3,182.5 | -4,369.0 |
| EBIT, % | -91.3 | -50.64 | -68.24 | -40.06 | 14.68 | -47.11 | -47.11 | -47.11 | -47.11 | -47.11 |
| Total Cash | 1,938.6 | 2,115.9 | 1,989.4 | 1,676.3 | 1,354.8 | 2,460.8 | 3,378.2 | 4,637.5 | 6,366.4 | 8,739.8 |
| Total Cash, percent | .0 | .0 | .0 | .0 | .0 | .0 | .0 | .0 | .0 | .0 |
| Account Receivables | 143.5 | 172.7 | 261.6 | 437.0 | 649.7 | 775.6 | 1,064.8 | 1,461.7 | 2,006.7 | 2,754.7 |
| Account Receivables, % | 26.57 | 24.61 | 28.04 | 35.15 | 34.16 | 29.71 | 29.71 | 29.71 | 29.71 | 29.71 |
| Inventories | 232.0 | 186.2 | 204.0 | 322.9 | 750.0 | 818.5 | 1,123.6 | 1,542.5 | 2,117.5 | 2,907.0 |
| Inventories, % | 42.95 | 26.53 | 21.86 | 25.97 | 39.43 | 31.35 | 31.35 | 31.35 | 31.35 | 31.35 |
| Accounts Payable | 111.1 | 76.7 | 95.9 | 164.9 | 214.4 | 346.3 | 475.4 | 652.6 | 895.9 | 1,230.0 |
| Accounts Payable, % | 20.57 | 10.93 | 10.28 | 13.26 | 11.27 | 13.26 | 13.26 | 13.26 | 13.26 | 13.26 |
| Capital Expenditure | -82.2 | -38.5 | -32.3 | -87.3 | -137.0 | -200.5 | -275.2 | -377.8 | -518.6 | -711.9 |
| Capital Expenditure, % | -15.22 | -5.48 | -3.46 | -7.03 | -7.2 | -7.68 | -7.68 | -7.68 | -7.68 | -7.68 |
| Tax Rate, % | 9.79 | 9.79 | 9.79 | 9.79 | 9.79 | 9.79 | 9.79 | 9.79 | 9.79 | 9.79 |
| EBITAT | -494.1 | -355.3 | -649.2 | -513.3 | 251.8 | -1,205.9 | -1,655.5 | -2,272.7 | -3,119.9 | -4,283.1 |
| Depreciation | ||||||||||
| Changes in Account Receivables | ||||||||||
| Changes in Inventories | ||||||||||
| Changes in Accounts Payable | ||||||||||
| Capital Expenditure | ||||||||||
| UFCF | -800.9 | -373.6 | -714.3 | -767.0 | -421.6 | -1,332.2 | -2,208.1 | -3,031.3 | -4,161.3 | -5,712.6 |
| WACC, % | 5.22 | 5.22 | 5.22 | 5.22 | 5.08 | 5.19 | 5.19 | 5.19 | 5.19 | 5.19 |
| PV UFCF | ||||||||||
| SUM PV UFCF | -13,699.4 | |||||||||
| Long Term Growth Rate, % | 2.00 | |||||||||
| Free cash flow (T + 1) | -5,827 | |||||||||
| Terminal Value | -182,474 | |||||||||
| Present Terminal Value | -141,665 | |||||||||
| Enterprise Value | -155,364 | |||||||||
| Net Debt | 240 | |||||||||
| Equity Value | -155,604 | |||||||||
| Diluted Shares Outstanding, MM | 108 | |||||||||
| Equity Value Per Share | -1,442.45 |
What You Will Receive
- Customizable Excel Template: A fully editable Excel-based DCF Calculator featuring pre-filled real SRPT financial data.
- Authentic Data: Access to historical figures and forward-looking projections (highlighted in the yellow cells).
- Flexible Forecasting: Adjust forecast parameters such as revenue growth, EBITDA %, and WACC.
- Instant Calculations: Quickly observe how your inputs influence Sarepta’s valuation.
- Professional Resource: Designed for investors, CFOs, consultants, and financial analysts.
- Intuitive Design: Organized for clarity and ease of navigation, complete with step-by-step guidance.
Key Features
- Comprehensive Clinical Data: Access detailed pre-loaded historical clinical trial results and future pipeline projections for Sarepta Therapeutics, Inc. (SRPT).
- Customizable Assumptions: Modify highlighted fields such as R&D expenses, market penetration rates, and pricing strategies.
- Real-Time Analytics: Automatic updates to valuation metrics, including Discounted Cash Flow (DCF) and Net Present Value (NPV).
- Interactive Dashboard: User-friendly charts and summaries to effectively visualize your investment analysis.
- Designed for All Users: An intuitive interface suitable for both seasoned investors and newcomers in the biotech sector.
How It Works
- Step 1: Download the prebuilt Excel template featuring Sarepta Therapeutics, Inc.'s (SRPT) data.
- Step 2: Review the pre-filled sheets to familiarize yourself with the essential metrics.
- Step 3: Modify forecasts and assumptions in the editable yellow cells (WACC, growth, margins).
- Step 4: Instantly see recalculated results, including Sarepta's intrinsic value.
- Step 5: Make informed investment choices or create reports based on the outputs.
Why Choose Sarepta Therapeutics, Inc. (SRPT)?
- Innovative Solutions: Cutting-edge therapies designed to address rare genetic diseases.
- Proven Expertise: A dedicated team of professionals with extensive experience in biotechnology.
- Commitment to Patients: Focused on improving the lives of individuals with serious medical conditions.
- Robust Pipeline: A diverse range of products in various stages of development.
- Industry Recognition: Acknowledged for leadership in gene therapy and muscular dystrophy treatments.
Who Should Use This Product?
- Investors: Evaluate Sarepta Therapeutics' (SRPT) market potential before making investment decisions.
- CFOs and Financial Analysts: Optimize valuation methodologies and assess future forecasts.
- Biotech Entrepreneurs: Understand how leading biotech firms like Sarepta Therapeutics are appraised.
- Consultants: Create comprehensive valuation reports for clients in the biotech sector.
- Students and Educators: Utilize real-world biotech data to learn and teach valuation principles.
What the Template Contains
- Operating and Balance Sheet Data: Pre-filled Sarepta Therapeutics historical data and forecasts, including revenue, EBITDA, EBIT, and capital expenditures.
- WACC Calculation: A dedicated sheet for Weighted Average Cost of Capital (WACC), including parameters like Beta, risk-free rate, and share price.
- DCF Valuation (Unlevered and Levered): Editable Discounted Cash Flow models showing intrinsic value with detailed calculations.
- Financial Statements: Pre-loaded financial statements (annual and quarterly) to support analysis.
- Key Ratios: Includes profitability, leverage, and efficiency ratios for Sarepta Therapeutics.
- Dashboard and Charts: Visual summary of valuation outputs and assumptions to analyze results easily.
Disclaimer
All information, articles, and product details provided on this website are for general informational and educational purposes only. We do not claim any ownership over, nor do we intend to infringe upon, any trademarks, copyrights, logos, brand names, or other intellectual property mentioned or depicted on this site. Such intellectual property remains the property of its respective owners, and any references here are made solely for identification or informational purposes, without implying any affiliation, endorsement, or partnership.
We make no representations or warranties, express or implied, regarding the accuracy, completeness, or suitability of any content or products presented. Nothing on this website should be construed as legal, tax, investment, financial, medical, or other professional advice. In addition, no part of this site—including articles or product references—constitutes a solicitation, recommendation, endorsement, advertisement, or offer to buy or sell any securities, franchises, or other financial instruments, particularly in jurisdictions where such activity would be unlawful.
All content is of a general nature and may not address the specific circumstances of any individual or entity. It is not a substitute for professional advice or services. Any actions you take based on the information provided here are strictly at your own risk. You accept full responsibility for any decisions or outcomes arising from your use of this website and agree to release us from any liability in connection with your use of, or reliance upon, the content or products found herein.