
|
SSE plc (SSE.L) DCF -Bewertung |
Fully Editable: Tailor To Your Needs In Excel Or Sheets
Professional Design: Trusted, Industry-Standard Templates
Investor-Approved Valuation Models
MAC/PC Compatible, Fully Unlocked
No Expertise Is Needed; Easy To Follow
SSE plc (SSE.L) Bundle
Entdecken Sie den tatsächlichen Wert von SSE plc mit unserem DCF-Taschenrechner von Professional Grade! Passen Sie die wichtigsten Annahmen an, erkunden Sie verschiedene Szenarien und bewerten Sie, wie sich Änderungen auf die Bewertung von SSE SPC auswirken - alles innerhalb einer einzigen Excel -Vorlage.
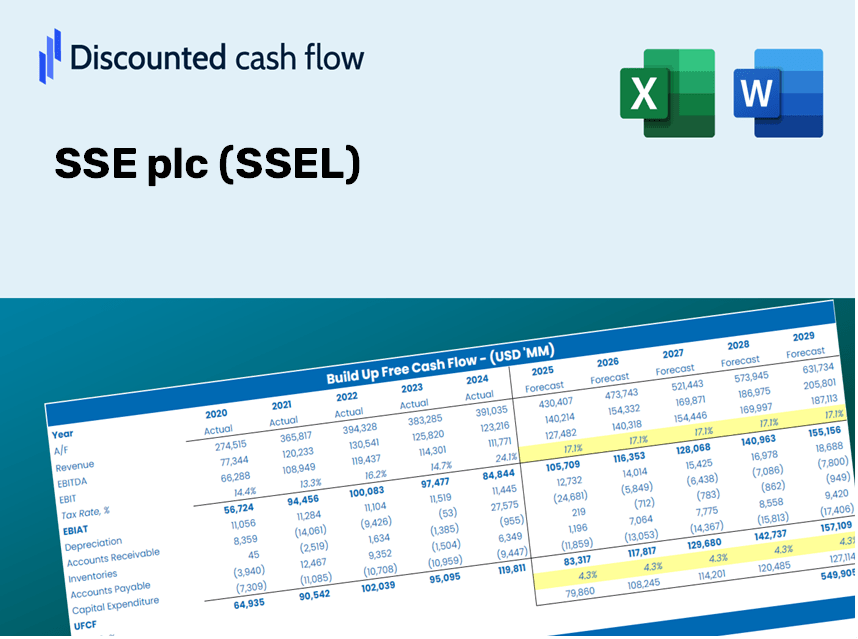
Discounted Cash Flow (DCF) - (USD MM)
| Year | AY1 2021 |
AY2 2022 |
AY3 2023 |
AY4 2024 |
AY5 2025 |
FY1 2026 |
FY2 2027 |
FY3 2028 |
FY4 2029 |
FY5 2030 |
|---|---|---|---|---|---|---|---|---|---|---|
| Revenue | 6,826.4 | 8,697.2 | 12,490.7 | 10,457.2 | 10,131.9 | 11,439.7 | 12,916.4 | 14,583.6 | 16,466.1 | 18,591.5 |
| Revenue Growth, % | 0 | 27.41 | 43.62 | -16.28 | -3.11 | 12.91 | 12.91 | 12.91 | 12.91 | 12.91 |
| EBITDA | 3,302.9 | 4,319.1 | 189.1 | 3,672.4 | 3,227.0 | 3,810.1 | 4,301.9 | 4,857.1 | 5,484.1 | 6,192.0 |
| EBITDA, % | 48.38 | 49.66 | 1.51 | 35.12 | 31.85 | 33.31 | 33.31 | 33.31 | 33.31 | 33.31 |
| Depreciation | 560.0 | 596.5 | 682.4 | 859.0 | 1,057.1 | 896.3 | 1,011.9 | 1,142.6 | 1,290.1 | 1,456.6 |
| Depreciation, % | 8.2 | 6.86 | 5.46 | 8.21 | 10.43 | 7.83 | 7.83 | 7.83 | 7.83 | 7.83 |
| EBIT | 2,742.9 | 3,722.6 | -493.3 | 2,813.4 | 2,169.9 | 2,913.8 | 3,289.9 | 3,714.6 | 4,194.0 | 4,735.4 |
| EBIT, % | 40.18 | 42.8 | -3.95 | 26.9 | 21.42 | 25.47 | 25.47 | 25.47 | 25.47 | 25.47 |
| Total Cash | 1,602.9 | 1,133.1 | 1,208.1 | 1,035.9 | 1,090.5 | 1,529.5 | 1,726.9 | 1,949.8 | 2,201.5 | 2,485.7 |
| Total Cash, percent | .0 | .0 | .0 | .0 | .0 | .0 | .0 | .0 | .0 | .0 |
| Account Receivables | 1,481.7 | 2,127.2 | 2,928.8 | 1,969.2 | 2,924.0 | 2,683.8 | 3,030.2 | 3,421.4 | 3,863.0 | 4,361.6 |
| Account Receivables, % | 21.71 | 24.46 | 23.45 | 18.83 | 28.86 | 23.46 | 23.46 | 23.46 | 23.46 | 23.46 |
| Inventories | 234.9 | .0 | 394.9 | 343.0 | 462.9 | 330.6 | 373.3 | 421.5 | 475.9 | 537.3 |
| Inventories, % | 3.44 | 0 | 3.16 | 3.28 | 4.57 | 2.89 | 2.89 | 2.89 | 2.89 | 2.89 |
| Accounts Payable | 433.3 | 919.7 | 694.6 | 656.7 | 710.7 | 818.6 | 924.2 | 1,043.5 | 1,178.2 | 1,330.3 |
| Accounts Payable, % | 6.35 | 10.57 | 5.56 | 6.28 | 7.01 | 7.16 | 7.16 | 7.16 | 7.16 | 7.16 |
| Capital Expenditure | -1,177.3 | -1,455.8 | -1,816.1 | -2,512.5 | -3,131.0 | -2,367.0 | -2,672.5 | -3,017.5 | -3,406.9 | -3,846.7 |
| Capital Expenditure, % | -17.25 | -16.74 | -14.54 | -24.03 | -30.9 | -20.69 | -20.69 | -20.69 | -20.69 | -20.69 |
| Tax Rate, % | 35.74 | 35.74 | 35.74 | 35.74 | 35.74 | 35.74 | 35.74 | 35.74 | 35.74 | 35.74 |
| EBITAT | 2,629.2 | 3,347.2 | -89.8 | 1,928.7 | 1,394.4 | 1,962.7 | 2,216.0 | 2,502.1 | 2,825.0 | 3,189.7 |
| Depreciation | ||||||||||
| Changes in Account Receivables | ||||||||||
| Changes in Inventories | ||||||||||
| Changes in Accounts Payable | ||||||||||
| Capital Expenditure | ||||||||||
| UFCF | 728.6 | 2,563.7 | -2,645.1 | 1,248.8 | -1,700.2 | 972.3 | 272.0 | 307.2 | 346.8 | 391.6 |
| WACC, % | 5.82 | 5.76 | 4.95 | 5.52 | 5.47 | 5.5 | 5.5 | 5.5 | 5.5 | 5.5 |
| PV UFCF | ||||||||||
| SUM PV UFCF | 2,007.0 | |||||||||
| Long Term Growth Rate, % | 3.00 | |||||||||
| Free cash flow (T + 1) | 403 | |||||||||
| Terminal Value | 16,110 | |||||||||
| Present Terminal Value | 12,325 | |||||||||
| Enterprise Value | 14,332 | |||||||||
| Net Debt | 9,514 | |||||||||
| Equity Value | 4,818 | |||||||||
| Diluted Shares Outstanding, MM | 1,100 | |||||||||
| Equity Value Per Share | 437.85 |
What You Will Receive
- Genuine SSE Financials: Features both historical and projected data for precise valuation.
- Customizable Parameters: Adjust WACC, tax rates, revenue growth, and capital expenditures as needed.
- Real-Time Calculations: Intrinsic value and NPV are computed automatically.
- Scenario Analysis: Evaluate various scenarios to assess SSE's future performance.
- User-Friendly Design: Crafted for professionals, yet easy for newcomers to navigate.
Key Features
- Pre-Loaded Data: SSE plc’s historical financial statements and pre-filled forecasts.
- Fully Adjustable Inputs: Modify WACC, tax rates, revenue growth, and EBITDA margins as needed.
- Instant Results: Watch SSE plc's intrinsic value update in real time.
- Clear Visual Outputs: Dashboard charts present valuation results and essential metrics.
- Built for Accuracy: A reliable tool designed for analysts, investors, and finance professionals.
How It Functions
- Download the Template: Gain immediate access to the Excel-based SSE plc (SSEL) DCF Calculator.
- Input Your Assumptions: Modify the yellow-highlighted cells for variables such as growth rates, WACC, margins, and more.
- Instant Calculations: The model will automatically refresh to display SSE plc's intrinsic value.
- Test Scenarios: Experiment with various assumptions to assess potential changes in valuation.
- Analyze and Decide: Utilize the findings to inform your investment or financial strategies.
Why Choose the SSE plc (SSEL) Calculator?
- Precision: Utilizes accurate SSE plc financial data to ensure reliability.
- Versatility: Allows users to experiment with and adjust inputs at their convenience.
- Efficiency: Eliminate the need to construct a DCF model from the ground up.
- Professional Quality: Crafted with the expertise and functionality expected at the CFO level.
- User-Friendly: Intuitive design makes it accessible for users with varying levels of financial expertise.
Who Can Benefit from This Product?
- Individual Investors: Gain insights to make educated decisions about purchasing or divesting in SSE plc (SSEL) stock.
- Financial Analysts: Enhance valuation methods with comprehensive financial models tailored for SSE plc (SSEL).
- Consultants: Provide clients with accurate and timely valuation analysis of SSE plc (SSEL).
- Business Owners: Learn how valuations of major corporations like SSE plc (SSEL) can inform your own business strategies.
- Finance Students: Acquire practical knowledge of valuation techniques through real-world examples involving SSE plc (SSEL).
Contents of the Template
- In-Depth DCF Model: Customizable template featuring comprehensive valuation calculations.
- Actual Data: SSE plc’s (SSEL) historical and forecasted financials preloaded for thorough analysis.
- Adjustable Parameters: Modify WACC, growth rates, and tax assumptions to explore various scenarios.
- Financial Statements: Complete annual and quarterly breakdowns for enhanced insights.
- Essential Ratios: Integrated analysis for profitability, efficiency, and leverage metrics.
- Visual Dashboard: Graphs and tables providing clear, actionable insights.
Disclaimer
All information, articles, and product details provided on this website are for general informational and educational purposes only. We do not claim any ownership over, nor do we intend to infringe upon, any trademarks, copyrights, logos, brand names, or other intellectual property mentioned or depicted on this site. Such intellectual property remains the property of its respective owners, and any references here are made solely for identification or informational purposes, without implying any affiliation, endorsement, or partnership.
We make no representations or warranties, express or implied, regarding the accuracy, completeness, or suitability of any content or products presented. Nothing on this website should be construed as legal, tax, investment, financial, medical, or other professional advice. In addition, no part of this site—including articles or product references—constitutes a solicitation, recommendation, endorsement, advertisement, or offer to buy or sell any securities, franchises, or other financial instruments, particularly in jurisdictions where such activity would be unlawful.
All content is of a general nature and may not address the specific circumstances of any individual or entity. It is not a substitute for professional advice or services. Any actions you take based on the information provided here are strictly at your own risk. You accept full responsibility for any decisions or outcomes arising from your use of this website and agree to release us from any liability in connection with your use of, or reliance upon, the content or products found herein.