
|
STAAR Surgical Company (STAA) DCF -Bewertung |
Fully Editable: Tailor To Your Needs In Excel Or Sheets
Professional Design: Trusted, Industry-Standard Templates
Investor-Approved Valuation Models
MAC/PC Compatible, Fully Unlocked
No Expertise Is Needed; Easy To Follow
STAAR Surgical Company (STAA) Bundle
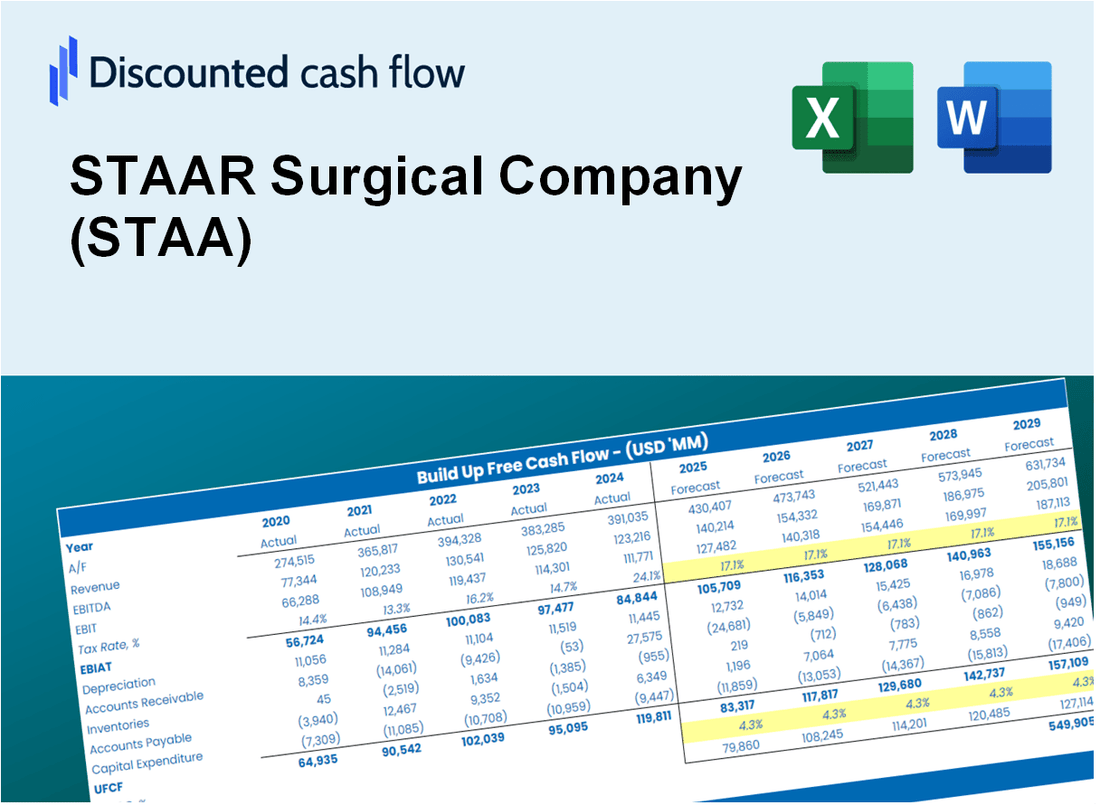
Unser (STAA) DCF-Taschenrechner entwickelt für die Genauigkeit und ermöglicht es Ihnen, die Bewertung des STAAR-Chirurgischen Unternehmens anhand von Finanzdaten der realen Welt zu bewerten und vollständige Flexibilität zu bieten, um alle wichtigen Parameter für verbesserte Projektionen zu ändern.
What You Will Receive
- Comprehensive Financial Model: STAAR Surgical Company’s actual performance data facilitates accurate DCF valuation.
- Complete Forecast Control: Modify revenue growth, profit margins, WACC, and other essential factors.
- Real-Time Calculations: Automatic updates provide immediate insights as you adjust parameters.
- Professional-Grade Template: A polished Excel file crafted for high-quality valuation presentations.
- Flexible and Reusable: Designed for adaptability, enabling frequent use for in-depth forecasts.
Key Features
- Comprehensive Data: STAAR Surgical Company’s historical financial statements and pre-filled projections.
- Customizable Variables: Adjust WACC, tax rates, revenue growth, and EBITDA margins as needed.
- Real-Time Insights: Observe STAAR Surgical’s intrinsic value recalculating instantly.
- Visual Representation: Dashboard graphs illustrate valuation outcomes and essential metrics.
- Precision Focused: A reliable tool designed for analysts, investors, and finance professionals.
How It Works
- 1. Download the Template: Obtain and open the Excel file containing STAAR Surgical Company's (STAA) preloaded data.
- 2. Adjust Key Inputs: Modify essential parameters such as growth rates, WACC, and capital expenditures.
- 3. Analyze Results in Real-Time: The DCF model automatically computes intrinsic value and NPV.
- 4. Explore Different Scenarios: Evaluate various forecasts to understand diverse valuation results.
- 5. Make Informed Decisions: Present expert valuation analyses to back your strategic choices.
Why Choose This Calculator for STAAR Surgical Company (STAA)?
- User-Friendly Interface: Tailored for both novices and seasoned professionals.
- Customizable Inputs: Adjust parameters easily to suit your financial analysis.
- Real-Time Feedback: Observe immediate updates to STAAR Surgical's valuation as you tweak inputs.
- Pre-Loaded Data: Comes with STAAR Surgical’s latest financial information for swift assessments.
- Preferred by Experts: Utilized by investors and analysts for making well-informed choices.
Who Should Use STAAR Surgical Company (STAA)?
- Healthcare Investors: Make informed investment choices with advanced insights into ophthalmic technologies.
- Market Analysts: Streamline your analysis process with comprehensive data on eye care innovations.
- Medical Consultants: Efficiently tailor presentations and reports for clients in the healthcare sector.
- Ophthalmology Enthusiasts: Enhance your knowledge of vision correction solutions through real-world applications.
- Educators and Students: Utilize it as a hands-on resource in medical and business education programs.
What the Template Contains
- Comprehensive DCF Model: Editable template featuring detailed valuation calculations tailored for STAAR Surgical Company (STAA).
- Real-World Data: STAAR Surgical’s historical and projected financials preloaded for in-depth analysis.
- Customizable Parameters: Modify WACC, growth rates, and tax assumptions to explore various scenarios.
- Financial Statements: Complete annual and quarterly breakdowns for enhanced insights into the company's performance.
- Key Ratios: Integrated analysis for profitability, efficiency, and leverage metrics specific to STAAR Surgical Company (STAA).
- Dashboard with Visual Outputs: Charts and tables providing clear, actionable results for informed decision-making.
Disclaimer
All information, articles, and product details provided on this website are for general informational and educational purposes only. We do not claim any ownership over, nor do we intend to infringe upon, any trademarks, copyrights, logos, brand names, or other intellectual property mentioned or depicted on this site. Such intellectual property remains the property of its respective owners, and any references here are made solely for identification or informational purposes, without implying any affiliation, endorsement, or partnership.
We make no representations or warranties, express or implied, regarding the accuracy, completeness, or suitability of any content or products presented. Nothing on this website should be construed as legal, tax, investment, financial, medical, or other professional advice. In addition, no part of this site—including articles or product references—constitutes a solicitation, recommendation, endorsement, advertisement, or offer to buy or sell any securities, franchises, or other financial instruments, particularly in jurisdictions where such activity would be unlawful.
All content is of a general nature and may not address the specific circumstances of any individual or entity. It is not a substitute for professional advice or services. Any actions you take based on the information provided here are strictly at your own risk. You accept full responsibility for any decisions or outcomes arising from your use of this website and agree to release us from any liability in connection with your use of, or reliance upon, the content or products found herein.