
|
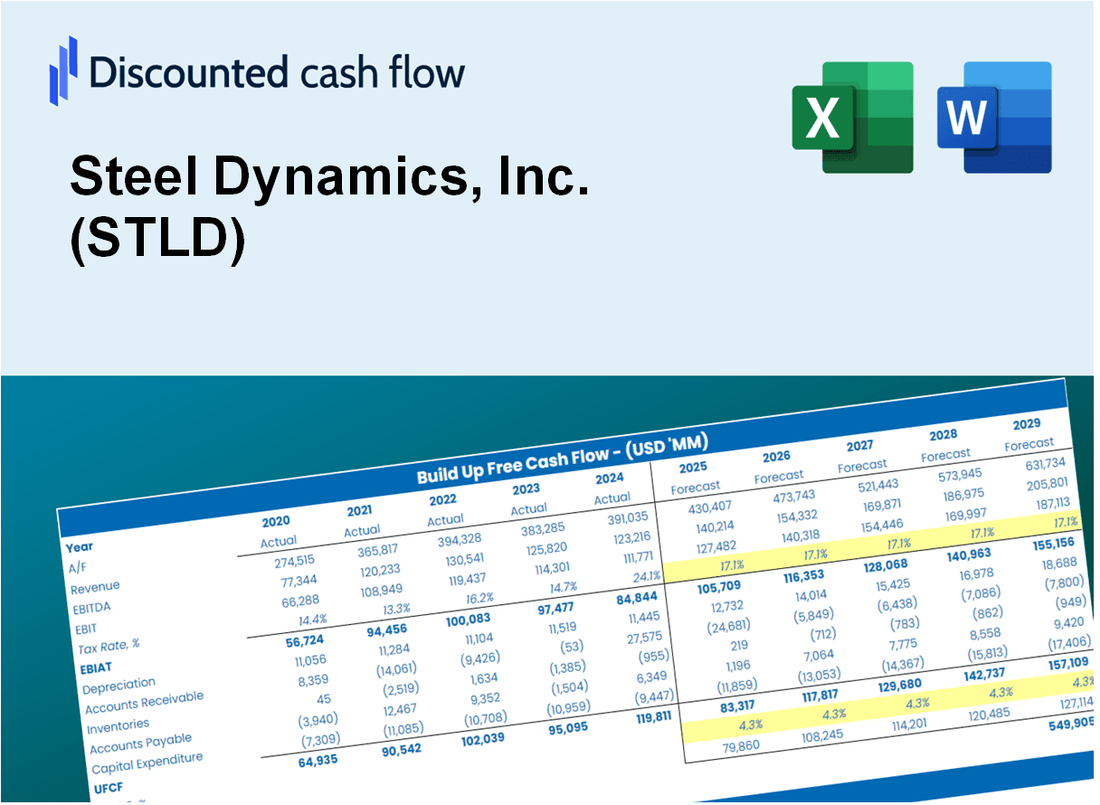
Stahldynamik, Inc. (STLD) DCF -Bewertung |
Fully Editable: Tailor To Your Needs In Excel Or Sheets
Professional Design: Trusted, Industry-Standard Templates
Investor-Approved Valuation Models
MAC/PC Compatible, Fully Unlocked
No Expertise Is Needed; Easy To Follow
Steel Dynamics, Inc. (STLD) Bundle
Unser DCF-Rechner von Steel Dynamics, Inc. (STLD) für Genauigkeit entwickelt, ermöglicht es Sie, die Bewertung der Stahldynamik mithilfe aktueller Finanzdaten zu bewerten und alle wichtigen Parameter für erweiterte Projektionen zu ändern.
Discounted Cash Flow (DCF) - (USD MM)
| Year | AY1 2020 |
AY2 2021 |
AY3 2022 |
AY4 2023 |
AY5 2024 |
FY1 2025 |
FY2 2026 |
FY3 2027 |
FY4 2028 |
FY5 2029 |
|---|---|---|---|---|---|---|---|---|---|---|
| Revenue | 9,601.5 | 18,408.9 | 22,260.8 | 18,795.3 | 17,540.4 | 21,504.9 | 26,365.5 | 32,324.7 | 39,630.9 | 48,588.4 |
| Revenue Growth, % | 0 | 91.73 | 20.92 | -15.57 | -6.68 | 22.6 | 22.6 | 22.6 | 22.6 | 22.6 |
| EBITDA | 1,126.1 | 4,613.9 | 5,496.8 | 3,733.2 | 2,518.1 | 4,116.2 | 5,046.6 | 6,187.2 | 7,585.7 | 9,300.2 |
| EBITDA, % | 11.73 | 25.06 | 24.69 | 19.86 | 14.36 | 19.14 | 19.14 | 19.14 | 19.14 | 19.14 |
| Depreciation | 325.8 | 347.7 | 384.2 | 437.8 | 478.9 | 519.0 | 636.3 | 780.1 | 956.5 | 1,172.6 |
| Depreciation, % | 3.39 | 1.89 | 1.73 | 2.33 | 2.73 | 2.41 | 2.41 | 2.41 | 2.41 | 2.41 |
| EBIT | 800.4 | 4,266.3 | 5,112.6 | 3,295.4 | 2,039.2 | 3,597.2 | 4,410.3 | 5,407.1 | 6,629.2 | 8,127.6 |
| EBIT, % | 8.34 | 23.18 | 22.97 | 17.53 | 11.63 | 16.73 | 16.73 | 16.73 | 16.73 | 16.73 |
| Total Cash | 1,368.6 | 1,243.9 | 2,256.6 | 2,122.1 | 737.3 | 2,006.1 | 2,459.5 | 3,015.4 | 3,696.9 | 4,532.5 |
| Total Cash, percent | .0 | .0 | .0 | .0 | .0 | .0 | .0 | .0 | .0 | .0 |
| Account Receivables | 971.9 | 1,916.4 | 2,056.1 | 1,608.3 | 1,417.2 | 1,995.9 | 2,447.0 | 3,000.1 | 3,678.2 | 4,509.6 |
| Account Receivables, % | 10.12 | 10.41 | 9.24 | 8.56 | 8.08 | 9.28 | 9.28 | 9.28 | 9.28 | 9.28 |
| Inventories | 1,843.5 | 3,531.1 | 3,130.0 | 2,894.6 | 3,113.7 | 3,681.4 | 4,513.5 | 5,533.7 | 6,784.4 | 8,317.9 |
| Inventories, % | 19.2 | 19.18 | 14.06 | 15.4 | 17.75 | 17.12 | 17.12 | 17.12 | 17.12 | 17.12 |
| Accounts Payable | 769.5 | 1,280.6 | 1,017.2 | 1,088.3 | 979.9 | 1,329.7 | 1,630.3 | 1,998.8 | 2,450.5 | 3,004.4 |
| Accounts Payable, % | 8.01 | 6.96 | 4.57 | 5.79 | 5.59 | 6.18 | 6.18 | 6.18 | 6.18 | 6.18 |
| Capital Expenditure | -1,198.1 | -1,006.2 | -908.9 | -1,657.9 | -1,868.0 | -1,784.8 | -2,188.2 | -2,682.8 | -3,289.2 | -4,032.6 |
| Capital Expenditure, % | -12.48 | -5.47 | -4.08 | -8.82 | -10.65 | -8.3 | -8.3 | -8.3 | -8.3 | -8.3 |
| Tax Rate, % | 22.48 | 22.48 | 22.48 | 22.48 | 22.48 | 22.48 | 22.48 | 22.48 | 22.48 | 22.48 |
| EBITAT | 624.9 | 3,257.8 | 3,933.1 | 2,509.1 | 1,580.8 | 2,770.0 | 3,396.1 | 4,163.7 | 5,104.9 | 6,258.7 |
| Depreciation | ||||||||||
| Changes in Account Receivables | ||||||||||
| Changes in Inventories | ||||||||||
| Changes in Accounts Payable | ||||||||||
| Capital Expenditure | ||||||||||
| UFCF | -2,293.4 | 478.2 | 3,406.6 | 2,043.2 | 55.3 | 707.7 | 861.6 | 1,056.3 | 1,295.1 | 1,587.8 |
| WACC, % | 9.28 | 9.27 | 9.27 | 9.27 | 9.28 | 9.27 | 9.27 | 9.27 | 9.27 | 9.27 |
| PV UFCF | ||||||||||
| SUM PV UFCF | 4,106.2 | |||||||||
| Long Term Growth Rate, % | 0.50 | |||||||||
| Free cash flow (T + 1) | 1,596 | |||||||||
| Terminal Value | 18,189 | |||||||||
| Present Terminal Value | 11,675 | |||||||||
| Enterprise Value | 15,781 | |||||||||
| Net Debt | 2,756 | |||||||||
| Equity Value | 13,025 | |||||||||
| Diluted Shares Outstanding, MM | 156 | |||||||||
| Equity Value Per Share | 83.42 |
What You Will Get
- Real STLD Financials: Access to both historical and projected data for precise valuation.
- Customizable Inputs: Adjust WACC, tax rates, revenue growth, and capital expenditures to fit your analysis.
- Dynamic Calculations: Intrinsic value and NPV are computed in real-time.
- Scenario Analysis: Explore various scenarios to assess Steel Dynamics' future performance.
- User-Friendly Design: Designed for industry professionals while remaining approachable for newcomers.
Key Features
- Comprehensive STLD Data: Pre-loaded with Steel Dynamics’ historical performance metrics and future projections.
- Customizable Assumptions: Tailor inputs for revenue growth, profit margins, weighted average cost of capital (WACC), tax rates, and capital expenditures.
- Interactive Valuation Framework: Real-time adjustments to Net Present Value (NPV) and intrinsic value based on user-defined parameters.
- Scenario Analysis: Develop various forecast scenarios to evaluate different valuation possibilities.
- Intuitive Interface: Clean, organized design suitable for both industry experts and newcomers.
How It Works
- 1. Download the Template: Obtain and open the Excel file featuring Steel Dynamics, Inc. (STLD)'s preloaded data.
- 2. Adjust Key Inputs: Modify essential variables such as growth rates, WACC, and capital expenditures.
- 3. Analyze Results Immediately: The DCF model automatically computes intrinsic value and NPV in real-time.
- 4. Explore Different Scenarios: Evaluate various forecasts to assess multiple valuation results.
- 5. Present with Assurance: Deliver professional valuation insights to bolster your decision-making process.
Why Choose This Calculator?
- User-Friendly Interface: Suitable for both novices and seasoned professionals.
- Customizable Inputs: Effortlessly adjust parameters to tailor your analysis.
- Real-Time Feedback: Observe immediate updates to Steel Dynamics, Inc.’s (STLD) valuation as you make changes.
- Preloaded Data: Comes equipped with Steel Dynamics, Inc.’s (STLD) actual financial information for swift evaluation.
- Relied Upon by Experts: Utilized by investors and analysts for making well-informed choices.
Who Should Use This Product?
- Investors: Evaluate Steel Dynamics, Inc. (STLD) valuation prior to making investment decisions.
- CFOs and Financial Analysts: Enhance valuation methodologies and assess financial forecasts.
- Startup Founders: Discover how leading public companies like Steel Dynamics, Inc. (STLD) are appraised.
- Consultants: Provide clients with detailed and professional valuation analyses.
- Students and Educators: Utilize current data to practice and instruct on valuation strategies.
What the Template Contains
- Historical Data: Includes Steel Dynamics, Inc. (STLD)’s past financials and baseline forecasts.
- DCF and Levered DCF Models: Detailed templates to calculate Steel Dynamics, Inc. (STLD)’s intrinsic value.
- WACC Sheet: Pre-built calculations for Weighted Average Cost of Capital.
- Editable Inputs: Modify key drivers like growth rates, EBITDA %, and CAPEX assumptions.
- Quarterly and Annual Statements: A complete breakdown of Steel Dynamics, Inc. (STLD)’s financials.
- Interactive Dashboard: Visualize valuation results and projections dynamically.
Disclaimer
All information, articles, and product details provided on this website are for general informational and educational purposes only. We do not claim any ownership over, nor do we intend to infringe upon, any trademarks, copyrights, logos, brand names, or other intellectual property mentioned or depicted on this site. Such intellectual property remains the property of its respective owners, and any references here are made solely for identification or informational purposes, without implying any affiliation, endorsement, or partnership.
We make no representations or warranties, express or implied, regarding the accuracy, completeness, or suitability of any content or products presented. Nothing on this website should be construed as legal, tax, investment, financial, medical, or other professional advice. In addition, no part of this site—including articles or product references—constitutes a solicitation, recommendation, endorsement, advertisement, or offer to buy or sell any securities, franchises, or other financial instruments, particularly in jurisdictions where such activity would be unlawful.
All content is of a general nature and may not address the specific circumstances of any individual or entity. It is not a substitute for professional advice or services. Any actions you take based on the information provided here are strictly at your own risk. You accept full responsibility for any decisions or outcomes arising from your use of this website and agree to release us from any liability in connection with your use of, or reliance upon, the content or products found herein.