
|
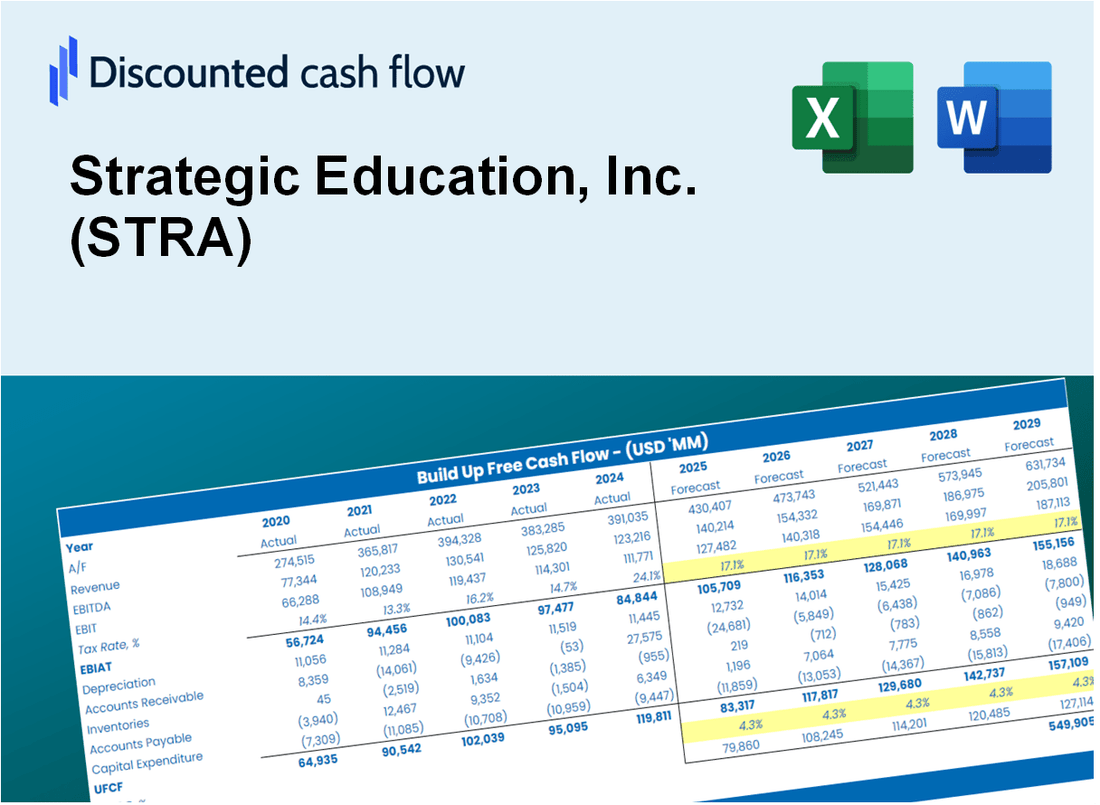
Strategic Education, Inc. (Straße) DCF -Bewertung |
Fully Editable: Tailor To Your Needs In Excel Or Sheets
Professional Design: Trusted, Industry-Standard Templates
Investor-Approved Valuation Models
MAC/PC Compatible, Fully Unlocked
No Expertise Is Needed; Easy To Follow
Strategic Education, Inc. (STRA) Bundle
Evaluieren Sie Strategic Education, Inc. (STR) finanzielle Aussichten wie ein Experte! Dieser (STR-) DCF-Taschenrechner verfügt über vorgefüllte Finanzdaten und bietet vollständige Flexibilität, um das Umsatzwachstum, WACC, Margen und andere wesentliche Annahmen zu ändern, um sich an Ihren Projektionen auszurichten.
Discounted Cash Flow (DCF) - (USD MM)
| Year | AY1 2020 |
AY2 2021 |
AY3 2022 |
AY4 2023 |
AY5 2024 |
FY1 2025 |
FY2 2026 |
FY3 2027 |
FY4 2028 |
FY5 2029 |
|---|---|---|---|---|---|---|---|---|---|---|
| Revenue | 1,027.7 | 1,131.7 | 1,065.5 | 1,132.9 | 1,219.9 | 1,275.7 | 1,334.0 | 1,395.0 | 1,458.7 | 1,525.4 |
| Revenue Growth, % | 0 | 10.12 | -5.85 | 6.33 | 7.68 | 4.57 | 4.57 | 4.57 | 4.57 | 4.57 |
| EBITDA | 244.7 | 214.0 | 137.1 | 170.4 | 201.7 | 222.4 | 232.6 | 243.2 | 254.3 | 265.9 |
| EBITDA, % | 23.81 | 18.91 | 12.87 | 15.04 | 16.53 | 17.43 | 17.43 | 17.43 | 17.43 | 17.43 |
| Depreciation | 109.2 | 103.4 | 63.1 | 57.3 | 44.4 | 87.7 | 91.7 | 95.9 | 100.3 | 104.9 |
| Depreciation, % | 10.62 | 9.14 | 5.92 | 5.06 | 3.64 | 6.88 | 6.88 | 6.88 | 6.88 | 6.88 |
| EBIT | 135.5 | 110.6 | 74.0 | 113.1 | 157.3 | 134.7 | 140.8 | 147.3 | 154.0 | 161.0 |
| EBIT, % | 13.19 | 9.77 | 6.94 | 9.98 | 12.89 | 10.56 | 10.56 | 10.56 | 10.56 | 10.56 |
| Total Cash | 195.1 | 275.4 | 222.8 | 208.2 | 184.0 | 249.3 | 260.6 | 272.6 | 285.0 | 298.0 |
| Total Cash, percent | .0 | .0 | .0 | .0 | .0 | .0 | .0 | .0 | .0 | .0 |
| Account Receivables | 51.6 | 51.6 | 63.0 | 76.1 | 76.1 | 72.6 | 75.9 | 79.4 | 83.0 | 86.8 |
| Account Receivables, % | 5.02 | 4.56 | 5.91 | 6.72 | 6.24 | 5.69 | 5.69 | 5.69 | 5.69 | 5.69 |
| Inventories | .0 | .0 | .0 | .0 | .0 | .0 | .0 | .0 | .0 | .0 |
| Inventories, % | 0 | 0 | 0 | 0 | 0 | 0 | 0 | 0 | 0 | 0 |
| Accounts Payable | 64.0 | 45.3 | 45.8 | 49.2 | 55.7 | 59.8 | 62.6 | 65.4 | 68.4 | 71.6 |
| Accounts Payable, % | 6.23 | 4.01 | 4.3 | 4.35 | 4.57 | 4.69 | 4.69 | 4.69 | 4.69 | 4.69 |
| Capital Expenditure | -46.8 | -49.4 | -43.2 | -36.9 | -40.6 | -49.9 | -52.2 | -54.6 | -57.1 | -59.7 |
| Capital Expenditure, % | -4.56 | -4.37 | -4.05 | -3.26 | -3.33 | -3.91 | -3.91 | -3.91 | -3.91 | -3.91 |
| Tax Rate, % | 30.2 | 30.2 | 30.2 | 30.2 | 30.2 | 30.2 | 30.2 | 30.2 | 30.2 | 30.2 |
| EBITAT | 102.6 | 79.5 | 49.6 | 78.4 | 109.8 | 95.3 | 99.6 | 104.2 | 109.0 | 113.9 |
| Depreciation | ||||||||||
| Changes in Account Receivables | ||||||||||
| Changes in Inventories | ||||||||||
| Changes in Accounts Payable | ||||||||||
| Capital Expenditure | ||||||||||
| UFCF | 177.4 | 114.8 | 58.7 | 89.0 | 120.0 | 140.8 | 138.6 | 144.9 | 151.6 | 158.5 |
| WACC, % | 6.23 | 6.22 | 6.21 | 6.21 | 6.22 | 6.22 | 6.22 | 6.22 | 6.22 | 6.22 |
| PV UFCF | ||||||||||
| SUM PV UFCF | 612.6 | |||||||||
| Long Term Growth Rate, % | 2.00 | |||||||||
| Free cash flow (T + 1) | 162 | |||||||||
| Terminal Value | 3,833 | |||||||||
| Present Terminal Value | 2,835 | |||||||||
| Enterprise Value | 3,447 | |||||||||
| Net Debt | -12 | |||||||||
| Equity Value | 3,459 | |||||||||
| Diluted Shares Outstanding, MM | 24 | |||||||||
| Equity Value Per Share | 143.30 |
What You Will Get
- Comprehensive STRA Financial Data: Pre-filled with Strategic Education’s historical and projected data for in-depth analysis.
- Fully Customizable Template: Easily adjust key inputs such as enrollment growth, operating margins, and tuition rates.
- Instant Calculations: Observe STRA’s intrinsic value update in real-time as you make adjustments.
- Professional Valuation Tool: Tailored for investors, analysts, and consultants seeking precise DCF outcomes.
- User-Friendly Interface: Intuitive layout and straightforward instructions suitable for all skill levels.
Key Features
- Comprehensive Financial Data: Gain access to precise historical metrics and future forecasts for Strategic Education, Inc. (STRA).
- Adjustable Forecast Inputs: Modify highlighted fields such as WACC, growth rates, and profit margins to suit your analysis.
- Real-Time Calculations: Instant updates to DCF, Net Present Value (NPV), and cash flow assessments.
- User-Friendly Dashboard: Clear charts and summaries designed to help you visualize valuation outcomes.
- Suitable for All Experience Levels: A straightforward, user-friendly format tailored for investors, CFOs, and consultants alike.
How It Works
- Step 1: Download the Excel file.
- Step 2: Review pre-entered Strategic Education, Inc. (STRA) data (historical and projected).
- Step 3: Adjust key assumptions (yellow cells) based on your analysis.
- Step 4: View automatic recalculations for Strategic Education, Inc.'s (STRA) intrinsic value.
- Step 5: Use the outputs for investment decisions or reporting.
Why Choose This Calculator for Strategic Education, Inc. (STRA)?
- Designed for Educators: A specialized tool tailored for educators, administrators, and financial analysts.
- Comprehensive Data: Strategic Education’s historical and projected financials are preloaded for precision.
- Flexible Scenario Analysis: Effortlessly simulate various forecasts and assumptions.
- Insightful Outputs: Automatically computes intrinsic value, NPV, and other essential metrics.
- User-Friendly: Clear, step-by-step instructions make navigation simple.
Who Should Use This Product?
- Investors: Accurately assess the fair value of Strategic Education, Inc. (STRA) before making investment decisions.
- CFOs: Utilize a professional-grade DCF model for financial reporting and analysis related to Strategic Education, Inc. (STRA).
- Consultants: Easily customize the template for valuation reports tailored to clients interested in Strategic Education, Inc. (STRA).
- Entrepreneurs: Discover insights into financial modeling practices utilized by leading education companies like Strategic Education, Inc. (STRA).
- Educators: Employ it as a teaching resource to illustrate valuation methodologies relevant to the education sector, including Strategic Education, Inc. (STRA).
What the Template Contains
- Preloaded STRA Data: Historical and projected financial data, including revenue, EBIT, and capital expenditures.
- DCF and WACC Models: Professional-grade sheets for calculating intrinsic value and Weighted Average Cost of Capital.
- Editable Inputs: Yellow-highlighted cells for adjusting revenue growth, tax rates, and discount rates.
- Financial Statements: Comprehensive annual and quarterly financials for deeper analysis.
- Key Ratios: Profitability, leverage, and efficiency ratios to evaluate performance.
- Dashboard and Charts: Visual summaries of valuation outcomes and assumptions.
Disclaimer
All information, articles, and product details provided on this website are for general informational and educational purposes only. We do not claim any ownership over, nor do we intend to infringe upon, any trademarks, copyrights, logos, brand names, or other intellectual property mentioned or depicted on this site. Such intellectual property remains the property of its respective owners, and any references here are made solely for identification or informational purposes, without implying any affiliation, endorsement, or partnership.
We make no representations or warranties, express or implied, regarding the accuracy, completeness, or suitability of any content or products presented. Nothing on this website should be construed as legal, tax, investment, financial, medical, or other professional advice. In addition, no part of this site—including articles or product references—constitutes a solicitation, recommendation, endorsement, advertisement, or offer to buy or sell any securities, franchises, or other financial instruments, particularly in jurisdictions where such activity would be unlawful.
All content is of a general nature and may not address the specific circumstances of any individual or entity. It is not a substitute for professional advice or services. Any actions you take based on the information provided here are strictly at your own risk. You accept full responsibility for any decisions or outcomes arising from your use of this website and agree to release us from any liability in connection with your use of, or reliance upon, the content or products found herein.