
|
Sterling Infrastructure, Inc. (STRL) DCF -Bewertung |
Fully Editable: Tailor To Your Needs In Excel Or Sheets
Professional Design: Trusted, Industry-Standard Templates
Investor-Approved Valuation Models
MAC/PC Compatible, Fully Unlocked
No Expertise Is Needed; Easy To Follow
Sterling Infrastructure, Inc. (STRL) Bundle
Entdecken Sie das wahre Potenzial von Sterling Infrastructure, Inc. (STRL) mit unserem fortschrittlichen DCF -Taschenrechner! Passen Sie die wichtigsten Annahmen an, erkunden Sie verschiedene Szenarien und beurteilen Sie, wie unterschiedliche Faktoren die Bewertung der Sterlingsinfrastruktur beeinflussen - alles innerhalb einer bequemen Excel -Vorlage.
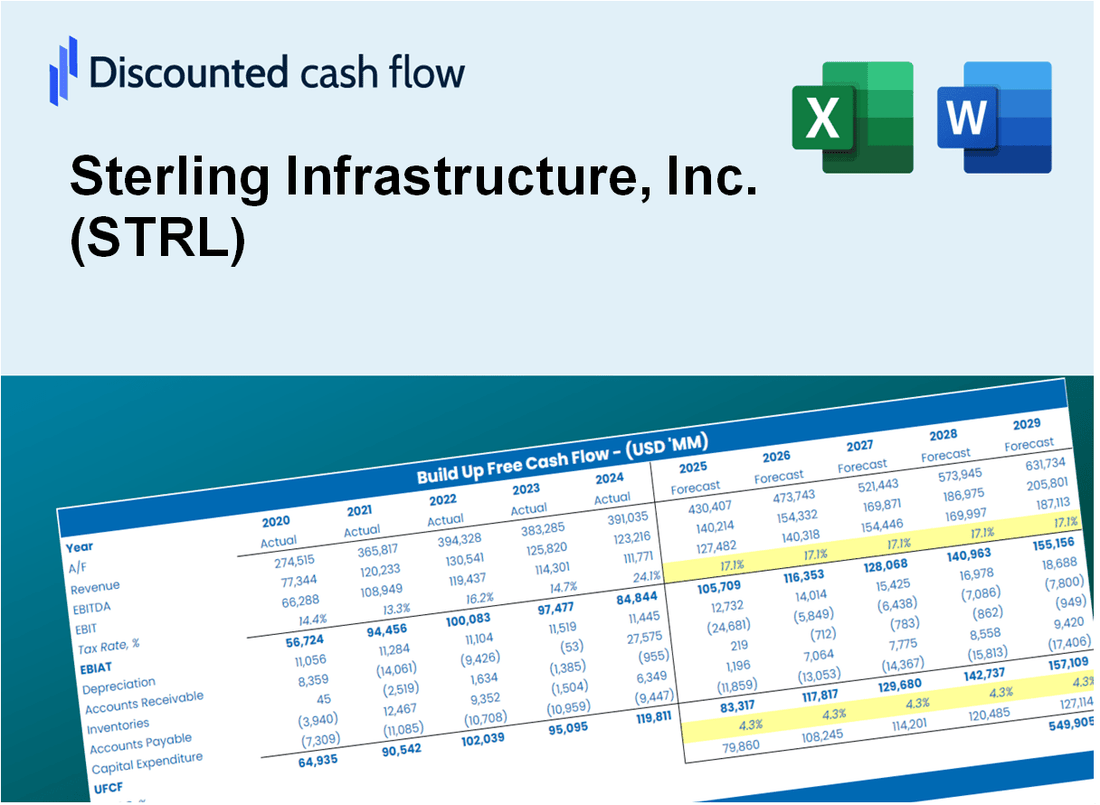
Discounted Cash Flow (DCF) - (USD MM)
| Year | AY1 2020 |
AY2 2021 |
AY3 2022 |
AY4 2023 |
AY5 2024 |
FY1 2025 |
FY2 2026 |
FY3 2027 |
FY4 2028 |
FY5 2029 |
|---|---|---|---|---|---|---|---|---|---|---|
| Revenue | 1,226.7 | 1,414.4 | 1,769.4 | 1,972.2 | 2,115.8 | 2,428.6 | 2,787.6 | 3,199.7 | 3,672.8 | 4,215.8 |
| Revenue Growth, % | 0 | 15.3 | 25.1 | 11.46 | 7.28 | 14.78 | 14.78 | 14.78 | 14.78 | 14.78 |
| EBITDA | 125.2 | 142.3 | 212.8 | 277.3 | 451.9 | 328.9 | 377.6 | 433.4 | 497.5 | 571.0 |
| EBITDA, % | 10.21 | 10.06 | 12.03 | 14.06 | 21.36 | 13.54 | 13.54 | 13.54 | 13.54 | 13.54 |
| Depreciation | 32.8 | 34.2 | 52.1 | 57.4 | 68.4 | 68.9 | 79.0 | 90.7 | 104.1 | 119.5 |
| Depreciation, % | 2.67 | 2.42 | 2.94 | 2.91 | 3.23 | 2.84 | 2.84 | 2.84 | 2.84 | 2.84 |
| EBIT | 92.5 | 108.1 | 160.8 | 219.9 | 383.5 | 260.1 | 298.5 | 342.7 | 393.3 | 451.5 |
| EBIT, % | 7.54 | 7.64 | 9.09 | 11.15 | 18.13 | 10.71 | 10.71 | 10.71 | 10.71 | 10.71 |
| Total Cash | 72.7 | 64.8 | 185.3 | 471.6 | 664.2 | 370.5 | 425.3 | 488.1 | 560.3 | 643.1 |
| Total Cash, percent | .0 | .0 | .0 | .0 | .0 | .0 | .0 | .0 | .0 | .0 |
| Account Receivables | 279.1 | 285.8 | 386.6 | 358.5 | 340.3 | 481.2 | 552.3 | 634.0 | 727.7 | 835.3 |
| Account Receivables, % | 22.75 | 20.21 | 21.85 | 18.18 | 16.08 | 19.81 | 19.81 | 19.81 | 19.81 | 19.81 |
| Inventories | .0 | .0 | .0 | .0 | .0 | .0 | .0 | .0 | .0 | .0 |
| Inventories, % | 0 | 0 | 0 | 0 | 0 | 0 | 0 | 0 | 0 | 0 |
| Accounts Payable | 95.2 | 112.7 | 121.9 | 146.0 | 130.4 | 175.8 | 201.7 | 231.6 | 265.8 | 305.1 |
| Accounts Payable, % | 7.76 | 7.97 | 6.89 | 7.4 | 6.16 | 7.24 | 7.24 | 7.24 | 7.24 | 7.24 |
| Capital Expenditure | -32.9 | -46.7 | -60.9 | -64.4 | -81.0 | -80.2 | -92.0 | -105.7 | -121.3 | -139.2 |
| Capital Expenditure, % | -2.68 | -3.3 | -3.44 | -3.26 | -3.83 | -3.3 | -3.3 | -3.3 | -3.3 | -3.3 |
| Tax Rate, % | 28.14 | 28.14 | 28.14 | 28.14 | 28.14 | 28.14 | 28.14 | 28.14 | 28.14 | 28.14 |
| EBITAT | 62.0 | 76.3 | 122.1 | 160.0 | 275.6 | 186.3 | 213.8 | 245.4 | 281.7 | 323.4 |
| Depreciation | ||||||||||
| Changes in Account Receivables | ||||||||||
| Changes in Inventories | ||||||||||
| Changes in Accounts Payable | ||||||||||
| Capital Expenditure | ||||||||||
| UFCF | -122.0 | 74.6 | 21.6 | 205.1 | 265.8 | 79.4 | 155.7 | 178.7 | 205.1 | 235.4 |
| WACC, % | 10.51 | 10.52 | 10.53 | 10.53 | 10.52 | 10.52 | 10.52 | 10.52 | 10.52 | 10.52 |
| PV UFCF | ||||||||||
| SUM PV UFCF | 611.8 | |||||||||
| Long Term Growth Rate, % | 3.50 | |||||||||
| Free cash flow (T + 1) | 244 | |||||||||
| Terminal Value | 3,469 | |||||||||
| Present Terminal Value | 2,103 | |||||||||
| Enterprise Value | 2,715 | |||||||||
| Net Debt | -295 | |||||||||
| Equity Value | 3,010 | |||||||||
| Diluted Shares Outstanding, MM | 31 | |||||||||
| Equity Value Per Share | 96.64 |
What You Will Get
- Real STRL Financials: Includes historical and forecasted data for precise valuation.
- Adjustable Inputs: Customize WACC, tax rates, revenue growth, and capital expenditures.
- Automatic Calculations: Intrinsic value and NPV are calculated in real-time.
- Scenario Analysis: Evaluate various scenarios to assess Sterling Infrastructure's future performance.
- Clear and Intuitive Design: Designed for professionals while remaining user-friendly for beginners.
Key Features
- Comprehensive DCF Calculator: Features both unlevered and levered DCF valuation models tailored for Sterling Infrastructure, Inc. (STRL).
- WACC Calculator: Includes a pre-designed Weighted Average Cost of Capital sheet with adjustable parameters.
- Customizable Forecast Assumptions: Easily alter growth rates, capital expenditures, and discount rates to suit your analysis.
- Integrated Financial Ratios: Examine profitability, leverage, and efficiency ratios specifically for Sterling Infrastructure, Inc. (STRL).
- Visual Dashboard and Charts: Graphical representations that highlight essential valuation metrics for straightforward evaluation.
How It Works
- Step 1: Download the Excel file.
- Step 2: Review pre-entered Sterling Infrastructure data (historical and projected).
- Step 3: Adjust key assumptions (yellow cells) based on your analysis.
- Step 4: View automatic recalculations for Sterling Infrastructure’s intrinsic value.
- Step 5: Use the outputs for investment decisions or reporting.
Why Choose Sterling Infrastructure, Inc. (STRL)?
- Streamlined Processes: Benefit from efficient infrastructure solutions without the hassle of complex setups.
- Enhanced Reliability: Our proven methodologies ensure dependable outcomes for every project.
- Fully Adaptable: Customize our services to meet your specific infrastructure needs and goals.
- User-Friendly Experience: Intuitive interfaces and clear reporting simplify project management.
- Endorsed by Industry Leaders: Trusted by professionals who prioritize quality and effectiveness.
Who Should Use This Product?
- Construction Management Students: Understand project evaluation methods and apply them with real-world data.
- Researchers: Integrate industry-standard models into academic studies or publications.
- Investors: Validate your investment strategies and assess valuation metrics for Sterling Infrastructure, Inc. (STRL).
- Financial Analysts: Enhance your analysis with a ready-to-use, customizable financial model.
- Contractors: Learn how leading firms like Sterling Infrastructure, Inc. (STRL) are evaluated in the market.
What the Template Contains
- Historical Data: Includes Sterling Infrastructure, Inc. (STRL)’s past financials and baseline forecasts.
- DCF and Levered DCF Models: Detailed templates to calculate Sterling Infrastructure, Inc. (STRL)’s intrinsic value.
- WACC Sheet: Pre-built calculations for Weighted Average Cost of Capital.
- Editable Inputs: Modify key drivers like growth rates, EBITDA %, and CAPEX assumptions.
- Quarterly and Annual Statements: A complete breakdown of Sterling Infrastructure, Inc. (STRL)’s financials.
- Interactive Dashboard: Visualize valuation results and projections dynamically.
Disclaimer
All information, articles, and product details provided on this website are for general informational and educational purposes only. We do not claim any ownership over, nor do we intend to infringe upon, any trademarks, copyrights, logos, brand names, or other intellectual property mentioned or depicted on this site. Such intellectual property remains the property of its respective owners, and any references here are made solely for identification or informational purposes, without implying any affiliation, endorsement, or partnership.
We make no representations or warranties, express or implied, regarding the accuracy, completeness, or suitability of any content or products presented. Nothing on this website should be construed as legal, tax, investment, financial, medical, or other professional advice. In addition, no part of this site—including articles or product references—constitutes a solicitation, recommendation, endorsement, advertisement, or offer to buy or sell any securities, franchises, or other financial instruments, particularly in jurisdictions where such activity would be unlawful.
All content is of a general nature and may not address the specific circumstances of any individual or entity. It is not a substitute for professional advice or services. Any actions you take based on the information provided here are strictly at your own risk. You accept full responsibility for any decisions or outcomes arising from your use of this website and agree to release us from any liability in connection with your use of, or reliance upon, the content or products found herein.