
|
Stratus Properties Inc. (STRS) DCF -Bewertung |
Fully Editable: Tailor To Your Needs In Excel Or Sheets
Professional Design: Trusted, Industry-Standard Templates
Investor-Approved Valuation Models
MAC/PC Compatible, Fully Unlocked
No Expertise Is Needed; Easy To Follow
Stratus Properties Inc. (STRS) Bundle
Unabhängig davon, ob Sie ein Investor oder ein Analyst sind, ist dieser (STRS) DCF-Taschenrechner Ihre Anlaufstelle für eine genaue Bewertung. Ausgestattet mit realen Daten von Stratus Properties Inc. können Sie Prognosen anpassen und die Auswirkungen sofort beobachten.
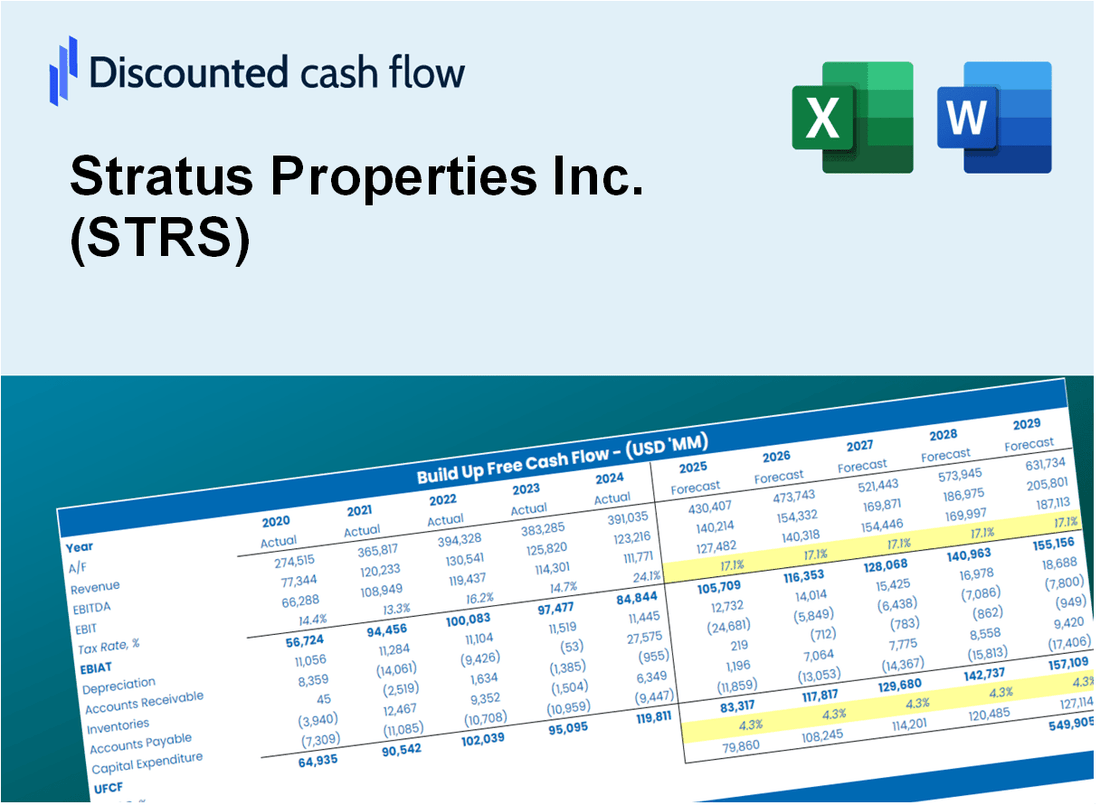
Discounted Cash Flow (DCF) - (USD MM)
| Year | AY1 2020 |
AY2 2021 |
AY3 2022 |
AY4 2023 |
AY5 2024 |
FY1 2025 |
FY2 2026 |
FY3 2027 |
FY4 2028 |
FY5 2029 |
|---|---|---|---|---|---|---|---|---|---|---|
| Revenue | 61.0 | 28.2 | 37.5 | 17.3 | 54.2 | 57.6 | 61.2 | 65.1 | 69.1 | 73.5 |
| Revenue Growth, % | 0 | -53.72 | 32.8 | -53.94 | 213.74 | 6.28 | 6.28 | 6.28 | 6.28 | 6.28 |
| EBITDA | 7.2 | -10.5 | -8.3 | -12.7 | 1.8 | -13.6 | -14.4 | -15.3 | -16.3 | -17.3 |
| EBITDA, % | 11.8 | -37.26 | -22.05 | -73.47 | 3.29 | -23.54 | -23.54 | -23.54 | -23.54 | -23.54 |
| Depreciation | 51.0 | 48.7 | 49.4 | 4.3 | 5.6 | 36.7 | 39.0 | 41.4 | 44.0 | 46.8 |
| Depreciation, % | 83.57 | 172.55 | 131.62 | 24.65 | 10.27 | 63.7 | 63.7 | 63.7 | 63.7 | 63.7 |
| EBIT | -43.8 | -59.2 | -57.6 | -16.9 | -3.8 | -43.4 | -46.1 | -49.0 | -52.1 | -55.4 |
| EBIT, % | -71.77 | -209.81 | -153.67 | -98.12 | -6.98 | -75.37 | -75.37 | -75.37 | -75.37 | -75.37 |
| Total Cash | 12.4 | 24.2 | 37.7 | 31.4 | 20.2 | 39.6 | 42.0 | 44.7 | 47.5 | 50.5 |
| Total Cash, percent | .0 | .0 | .0 | .0 | .0 | .0 | .0 | .0 | .0 | .0 |
| Account Receivables | .0 | .0 | .0 | .0 | .0 | .0 | .0 | .0 | .0 | .0 |
| Account Receivables, % | 0 | 0 | 0 | 0 | 0 | 0 | 0 | 0 | 0 | 0 |
| Inventories | 4.2 | 1.8 | 1.8 | 7.4 | 11.2 | 9.4 | 10.0 | 10.6 | 11.2 | 12.0 |
| Inventories, % | 6.89 | 6.28 | 4.73 | 42.74 | 20.69 | 16.27 | 16.27 | 16.27 | 16.27 | 16.27 |
| Accounts Payable | 7.5 | 14.1 | 15.2 | 15.6 | 10.1 | 24.4 | 25.9 | 27.6 | 29.3 | 31.1 |
| Accounts Payable, % | 12.22 | 50 | 40.65 | 90.5 | 18.57 | 42.39 | 42.39 | 42.39 | 42.39 | 42.39 |
| Capital Expenditure | -6.2 | -19.6 | -54.8 | -46.0 | -29.1 | -38.4 | -40.8 | -43.4 | -46.1 | -49.0 |
| Capital Expenditure, % | -10.15 | -69.28 | -146.18 | -266.14 | -53.77 | -66.64 | -66.64 | -66.64 | -66.64 | -66.64 |
| Tax Rate, % | 233.42 | 233.42 | 233.42 | 233.42 | 233.42 | 233.42 | 233.42 | 233.42 | 233.42 | 233.42 |
| EBITAT | -51.9 | -41.4 | -61.0 | -16.8 | 5.0 | -32.0 | -34.0 | -36.2 | -38.4 | -40.9 |
| Depreciation | ||||||||||
| Changes in Account Receivables | ||||||||||
| Changes in Inventories | ||||||||||
| Changes in Accounts Payable | ||||||||||
| Capital Expenditure | ||||||||||
| UFCF | -3.8 | -3.2 | -65.3 | -63.7 | -27.9 | -17.5 | -34.9 | -37.1 | -39.4 | -41.9 |
| WACC, % | 6.57 | 5.92 | 6.57 | 6.55 | 4.4 | 6 | 6 | 6 | 6 | 6 |
| PV UFCF | ||||||||||
| SUM PV UFCF | -141.2 | |||||||||
| Long Term Growth Rate, % | 3.00 | |||||||||
| Free cash flow (T + 1) | -43 | |||||||||
| Terminal Value | -1,438 | |||||||||
| Present Terminal Value | -1,075 | |||||||||
| Enterprise Value | -1,216 | |||||||||
| Net Debt | 190 | |||||||||
| Equity Value | -1,406 | |||||||||
| Diluted Shares Outstanding, MM | 8 | |||||||||
| Equity Value Per Share | -171.68 |
What You Will Get
- Editable Excel Template: A fully customizable Excel-based DCF Calculator featuring pre-filled real STRS financials.
- Real-World Data: Historical data and forward-looking estimates (as represented in the yellow cells).
- Forecast Flexibility: Adjust forecast assumptions such as revenue growth, EBITDA %, and WACC.
- Automatic Calculations: Instantly observe the effect of your inputs on Stratus Properties’ valuation.
- Professional Tool: Designed for investors, CFOs, consultants, and financial analysts.
- User-Friendly Design: Organized for clarity and ease of use, complete with step-by-step instructions.
Key Features
- Customizable Financial Inputs: Adjust essential parameters such as revenue projections, operating margins, and investment costs.
- Instant DCF Valuation: Automatically computes intrinsic value, NPV, and various financial metrics in real-time.
- High-Precision Accuracy: Leverages Stratus Properties Inc.'s (STRS) actual financial data for dependable valuation results.
- Effortless Scenario Testing: Easily evaluate different scenarios and analyze results side by side.
- Efficiency Booster: Streamlines the valuation process, eliminating the need for complex model development from the ground up.
How It Works
- Step 1: Download the Excel file.
- Step 2: Review pre-entered Stratus Properties Inc. (STRS) data (historical and projected).
- Step 3: Adjust key assumptions (yellow cells) based on your analysis.
- Step 4: View automatic recalculations for Stratus Properties Inc. (STRS) intrinsic value.
- Step 5: Use the outputs for investment decisions or reporting.
Why Choose This Calculator for Stratus Properties Inc. (STRS)?
- Designed for Industry Experts: A sophisticated tool tailored for real estate analysts, investors, and financial advisors.
- Comprehensive Data: Stratus Properties’ historical and projected financials are preloaded for precision.
- Flexible Scenario Analysis: Effortlessly test various market conditions and investment assumptions.
- Insightful Outputs: Automatically computes intrinsic value, NPV, and essential financial metrics.
- User-Friendly Interface: Step-by-step guidance ensures a seamless experience throughout the calculation process.
Who Should Use This Product?
- Investors: Accurately assess Stratus Properties Inc.'s (STRS) fair value prior to making investment choices.
- CFOs: Utilize a professional-grade DCF model for comprehensive financial reporting and analysis.
- Consultants: Easily customize the template for valuation reports tailored to clients.
- Entrepreneurs: Acquire insights into the financial modeling practices of leading real estate companies.
- Educators: Employ it as an educational resource to illustrate valuation techniques.
What the Template Contains
- Comprehensive DCF Model: Editable template featuring thorough valuation calculations.
- Real-World Data: Stratus Properties Inc.’s (STRS) historical and projected financials preloaded for analysis.
- Customizable Parameters: Adjust WACC, growth rates, and tax assumptions to explore different scenarios.
- Financial Statements: Complete annual and quarterly breakdowns for in-depth insights.
- Key Ratios: Integrated analysis for profitability, efficiency, and leverage metrics.
- Dashboard with Visual Outputs: Charts and tables presenting clear, actionable results.
Disclaimer
All information, articles, and product details provided on this website are for general informational and educational purposes only. We do not claim any ownership over, nor do we intend to infringe upon, any trademarks, copyrights, logos, brand names, or other intellectual property mentioned or depicted on this site. Such intellectual property remains the property of its respective owners, and any references here are made solely for identification or informational purposes, without implying any affiliation, endorsement, or partnership.
We make no representations or warranties, express or implied, regarding the accuracy, completeness, or suitability of any content or products presented. Nothing on this website should be construed as legal, tax, investment, financial, medical, or other professional advice. In addition, no part of this site—including articles or product references—constitutes a solicitation, recommendation, endorsement, advertisement, or offer to buy or sell any securities, franchises, or other financial instruments, particularly in jurisdictions where such activity would be unlawful.
All content is of a general nature and may not address the specific circumstances of any individual or entity. It is not a substitute for professional advice or services. Any actions you take based on the information provided here are strictly at your own risk. You accept full responsibility for any decisions or outcomes arising from your use of this website and agree to release us from any liability in connection with your use of, or reliance upon, the content or products found herein.