
|
Springworks Therapeutics, Inc. (SWTX) DCF -Bewertung |
Fully Editable: Tailor To Your Needs In Excel Or Sheets
Professional Design: Trusted, Industry-Standard Templates
Investor-Approved Valuation Models
MAC/PC Compatible, Fully Unlocked
No Expertise Is Needed; Easy To Follow
SpringWorks Therapeutics, Inc. (SWTX) Bundle
Entdecken Sie die finanzielle Zukunft von Springworks Therapeutics, Inc. (SWTX) mit unserem benutzerfreundlichen DCF-Taschenrechner! Geben Sie Ihre Annahmen in Bezug auf Wachstum, Margen und Kosten ein, um den inneren Wert von Springworks Therapeutics, Inc. (SWTX) aufzudecken und Ihre Anlagestrategie zu verbessern.
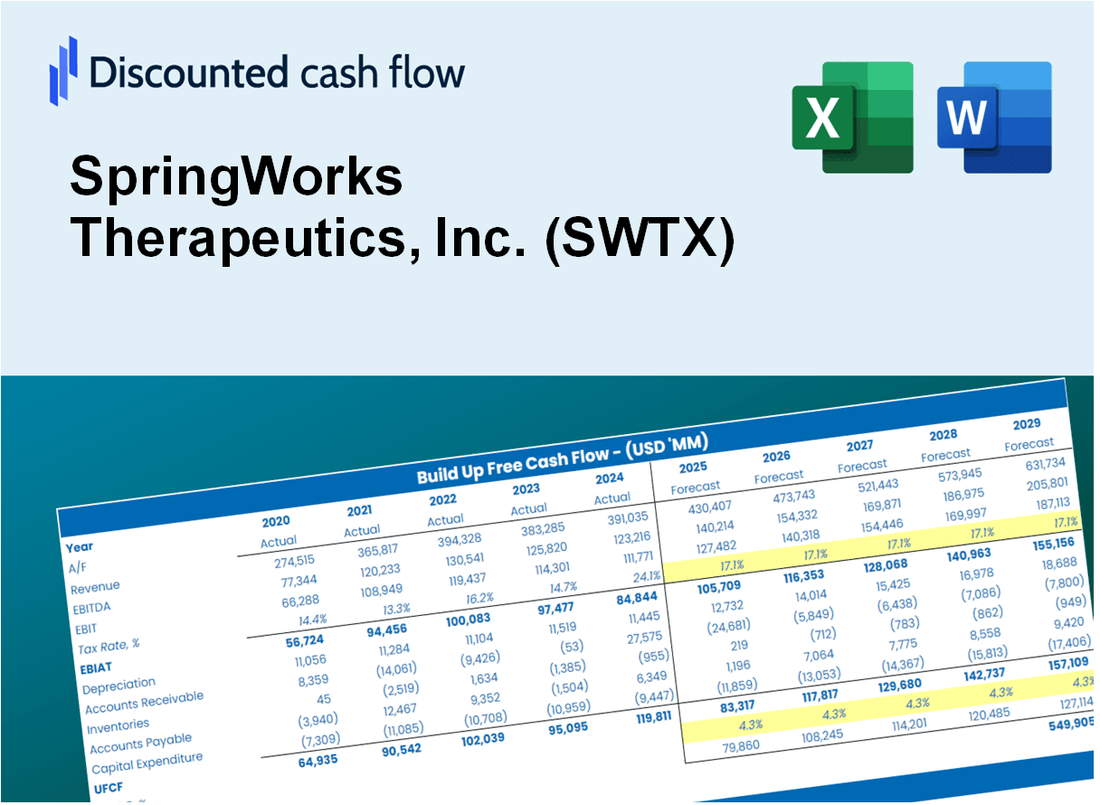
Discounted Cash Flow (DCF) - (USD MM)
| Year | AY1 2020 |
AY2 2021 |
AY3 2022 |
AY4 2023 |
AY5 2024 |
FY1 2025 |
FY2 2026 |
FY3 2027 |
FY4 2028 |
FY5 2029 |
|---|---|---|---|---|---|---|---|---|---|---|
| Revenue | 35.0 | .0 | 6.1 | 5.4 | 191.6 | 186.1 | 180.8 | 175.7 | 170.7 | 165.8 |
| Revenue Growth, % | 0 | -100 | 0 | -11.39 | 3417.33 | -2.85 | -2.85 | -2.85 | -2.85 | -2.85 |
| EBITDA | -46.0 | -173.0 | -280.7 | -341.3 | -278.1 | -111.7 | -108.5 | -105.4 | -102.4 | -99.5 |
| EBITDA, % | -131.36 | 100 | -4566.03 | -6266.68 | -145.17 | -60 | -60 | -60 | -60 | -60 |
| Depreciation | .3 | .5 | 1.9 | 1.7 | .0 | 60.5 | 58.8 | 57.1 | 55.5 | 53.9 |
| Depreciation, % | 0.99714 | 100 | 30.84 | 30.6 | 0 | 32.49 | 32.49 | 32.49 | 32.49 | 32.49 |
| EBIT | -46.3 | -173.5 | -282.6 | -343.0 | -278.1 | -111.7 | -108.5 | -105.4 | -102.4 | -99.5 |
| EBIT, % | -132.35 | 100 | -4596.88 | -6297.28 | -145.17 | -60 | -60 | -60 | -60 | -60 |
| Total Cash | 508.5 | 373.5 | 597.0 | 479.2 | 308.0 | 186.1 | 180.8 | 175.7 | 170.7 | 165.8 |
| Total Cash, percent | .0 | .0 | .0 | .0 | .0 | .0 | .0 | .0 | .0 | .0 |
| Account Receivables | .0 | .0 | .0 | 5.9 | 46.2 | 83.4 | 81.1 | 78.8 | 76.5 | 74.3 |
| Account Receivables, % | 0 | 100 | 0 | 108.87 | 24.13 | 44.83 | 44.83 | 44.83 | 44.83 | 44.83 |
| Inventories | .0 | .0 | .0 | 3.1 | 10.2 | 60.4 | 58.7 | 57.0 | 55.4 | 53.8 |
| Inventories, % | 0 | 100 | 0 | 56.97 | 5.33 | 32.46 | 32.46 | 32.46 | 32.46 | 32.46 |
| Accounts Payable | 1.4 | 3.4 | 8.0 | 7.4 | 12.2 | 115.5 | 112.2 | 109.0 | 105.9 | 102.9 |
| Accounts Payable, % | 3.86 | 100 | 130.31 | 135.78 | 6.39 | 62.05 | 62.05 | 62.05 | 62.05 | 62.05 |
| Capital Expenditure | -.6 | -2.0 | -10.2 | -7.4 | -4.5 | -76.0 | -73.8 | -71.7 | -69.7 | -67.7 |
| Capital Expenditure, % | -1.83 | 100 | -165.87 | -135.58 | -2.32 | -40.83 | -40.83 | -40.83 | -40.83 | -40.83 |
| Tax Rate, % | 0 | 0 | 0 | 0 | 0 | 0 | 0 | 0 | 0 | 0 |
| EBITAT | -45.0 | -172.8 | -279.3 | -343.0 | -278.1 | -110.7 | -107.5 | -104.5 | -101.5 | -98.6 |
| Depreciation | ||||||||||
| Changes in Account Receivables | ||||||||||
| Changes in Inventories | ||||||||||
| Changes in Accounts Payable | ||||||||||
| Capital Expenditure | ||||||||||
| UFCF | -43.9 | -172.2 | -283.0 | -358.4 | -325.1 | -110.4 | -121.8 | -118.3 | -115.0 | -111.7 |
| WACC, % | 7.27 | 7.27 | 7.27 | 7.27 | 7.27 | 7.27 | 7.27 | 7.27 | 7.27 | 7.27 |
| PV UFCF | ||||||||||
| SUM PV UFCF | -470.1 | |||||||||
| Long Term Growth Rate, % | 2.00 | |||||||||
| Free cash flow (T + 1) | -114 | |||||||||
| Terminal Value | -2,163 | |||||||||
| Present Terminal Value | -1,523 | |||||||||
| Enterprise Value | -1,993 | |||||||||
| Net Debt | -62 | |||||||||
| Equity Value | -1,931 | |||||||||
| Diluted Shares Outstanding, MM | 74 | |||||||||
| Equity Value Per Share | -26.05 |
What You Will Get
- Real SpringWorks Data: Preloaded financials – from revenue to EBIT – based on actual and projected figures for SpringWorks Therapeutics, Inc. (SWTX).
- Full Customization: Adjust all critical parameters (yellow cells) like WACC, growth %, and tax rates to suit your analysis needs.
- Instant Valuation Updates: Automatic recalculations to assess the impact of changes on SpringWorks' fair value.
- Versatile Excel Template: Designed for quick edits, scenario testing, and comprehensive projections.
- Time-Saving and Accurate: Eliminate the hassle of building models from scratch while ensuring precision and adaptability.
Key Features
- Comprehensive DCF Calculator: Features detailed unlevered and levered DCF valuation models tailored for SpringWorks Therapeutics, Inc. (SWTX).
- WACC Calculator: Pre-built Weighted Average Cost of Capital sheet with customizable inputs specific to the biotech sector.
- Customizable Forecast Assumptions: Adjust growth rates, research and development expenditures, and discount rates as needed.
- Integrated Financial Ratios: Evaluate profitability, leverage, and efficiency ratios relevant to SpringWorks Therapeutics, Inc. (SWTX).
- Interactive Dashboard and Charts: Visual representations that summarize key valuation metrics for straightforward analysis.
How It Works
- Step 1: Download the Excel file.
- Step 2: Review pre-entered SpringWorks Therapeutics data (historical and projected).
- Step 3: Adjust key assumptions (yellow cells) based on your analysis.
- Step 4: View automatic recalculations for SpringWorks Therapeutics' intrinsic value.
- Step 5: Use the outputs for investment decisions or reporting.
Why Choose SpringWorks Therapeutics, Inc. (SWTX)?
- Innovative Solutions: Access cutting-edge therapies designed to tackle unmet medical needs.
- Commitment to Quality: Rigorous research and development processes ensure high standards.
- Patient-Centric Approach: Focused on improving patient outcomes through tailored treatments.
- Expert Team: Collaborate with industry leaders and experienced professionals in the field.
- Proven Track Record: Backed by successful clinical trials and positive patient feedback.
Who Should Use This Product?
- Individual Investors: Gain insights to make informed decisions about buying or selling SpringWorks Therapeutics stock (SWTX).
- Financial Analysts: Enhance valuation processes with comprehensive financial models tailored for SpringWorks Therapeutics.
- Consultants: Provide clients with accurate and timely valuation insights for SpringWorks Therapeutics.
- Business Owners: Learn how biotech companies like SpringWorks Therapeutics are valued to inform your own business strategies.
- Finance Students: Explore valuation methodologies using real-world data and case studies from SpringWorks Therapeutics.
What the Template Contains
- Operating and Balance Sheet Data: Pre-filled SpringWorks Therapeutics historical data and forecasts, including revenue, EBITDA, EBIT, and capital expenditures.
- WACC Calculation: A dedicated sheet for Weighted Average Cost of Capital (WACC), including parameters like Beta, risk-free rate, and share price.
- DCF Valuation (Unlevered and Levered): Editable Discounted Cash Flow models showing intrinsic value with detailed calculations.
- Financial Statements: Pre-loaded financial statements (annual and quarterly) to support analysis.
- Key Ratios: Includes profitability, leverage, and efficiency ratios for SpringWorks Therapeutics (SWTX).
- Dashboard and Charts: Visual summary of valuation outputs and assumptions to analyze results easily.
Disclaimer
All information, articles, and product details provided on this website are for general informational and educational purposes only. We do not claim any ownership over, nor do we intend to infringe upon, any trademarks, copyrights, logos, brand names, or other intellectual property mentioned or depicted on this site. Such intellectual property remains the property of its respective owners, and any references here are made solely for identification or informational purposes, without implying any affiliation, endorsement, or partnership.
We make no representations or warranties, express or implied, regarding the accuracy, completeness, or suitability of any content or products presented. Nothing on this website should be construed as legal, tax, investment, financial, medical, or other professional advice. In addition, no part of this site—including articles or product references—constitutes a solicitation, recommendation, endorsement, advertisement, or offer to buy or sell any securities, franchises, or other financial instruments, particularly in jurisdictions where such activity would be unlawful.
All content is of a general nature and may not address the specific circumstances of any individual or entity. It is not a substitute for professional advice or services. Any actions you take based on the information provided here are strictly at your own risk. You accept full responsibility for any decisions or outcomes arising from your use of this website and agree to release us from any liability in connection with your use of, or reliance upon, the content or products found herein.