
|
DCF -Bewertung der Standex International Corporation (SXI) |
Fully Editable: Tailor To Your Needs In Excel Or Sheets
Professional Design: Trusted, Industry-Standard Templates
Investor-Approved Valuation Models
MAC/PC Compatible, Fully Unlocked
No Expertise Is Needed; Easy To Follow
Standex International Corporation (SXI) Bundle
Entdecken Sie den tatsächlichen Wert der Standex International Corporation (SXI) mit unserem DCF-Taschenrechner für professionelle Qualitätsqualität! Passen Sie die wichtigsten Annahmen an, erkunden Sie verschiedene Szenarien und bewerten Sie, wie sich Änderungen auf die Bewertung der Standex International Corporation (SXI) auswirken - alles innerhalb einer einzigen Excel -Vorlage.
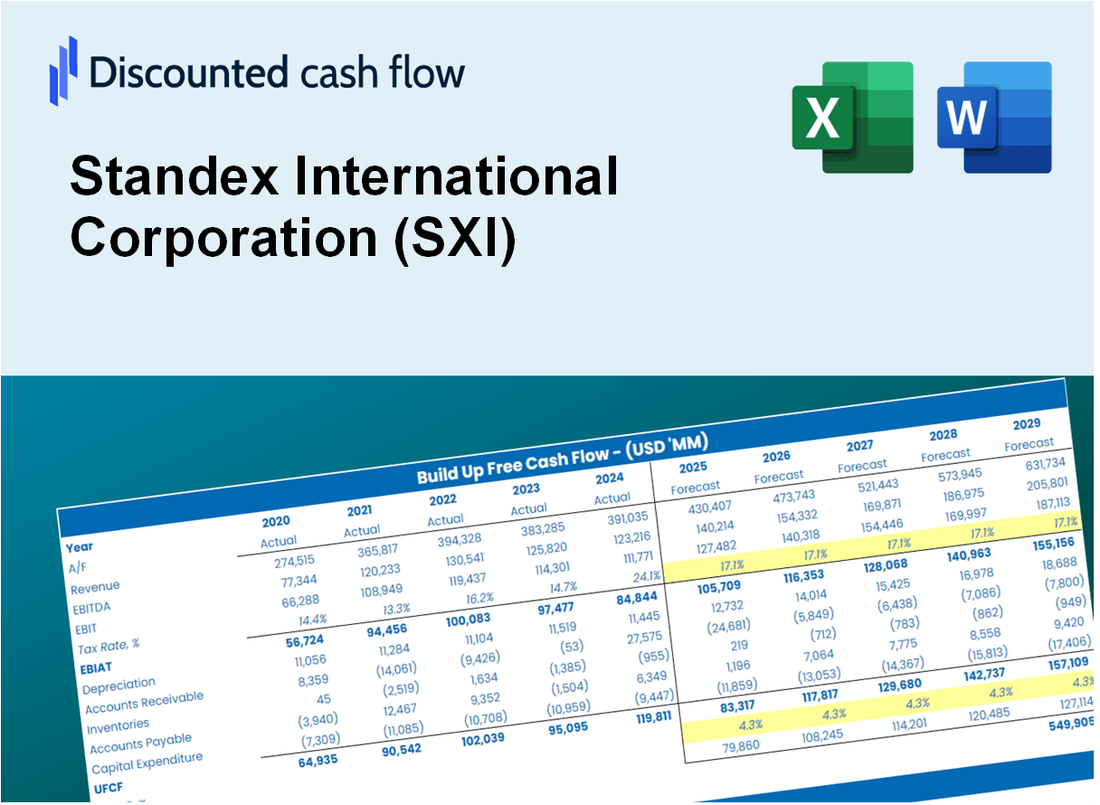
Discounted Cash Flow (DCF) - (USD MM)
| Year | AY1 2021 |
AY2 2022 |
AY3 2023 |
AY4 2024 |
AY5 2025 |
FY1 2026 |
FY2 2027 |
FY3 2028 |
FY4 2029 |
FY5 2030 |
|---|---|---|---|---|---|---|---|---|---|---|
| Revenue | 656.2 | 735.3 | 741.0 | 720.6 | 790.1 | 829.1 | 869.9 | 912.8 | 957.8 | 1,005.0 |
| Revenue Growth, % | 0 | 12.05 | 0.77638 | -2.75 | 9.64 | 4.93 | 4.93 | 4.93 | 4.93 | 4.93 |
| EBITDA | 92.0 | 116.6 | 191.5 | 121.9 | 128.2 | 147.3 | 154.6 | 162.2 | 170.2 | 178.6 |
| EBITDA, % | 14.02 | 15.86 | 25.84 | 16.92 | 16.22 | 17.77 | 17.77 | 17.77 | 17.77 | 17.77 |
| Depreciation | 31.0 | 27.5 | 26.8 | 26.8 | 35.4 | 33.6 | 35.3 | 37.0 | 38.9 | 40.8 |
| Depreciation, % | 4.72 | 3.74 | 3.62 | 3.72 | 4.49 | 4.06 | 4.06 | 4.06 | 4.06 | 4.06 |
| EBIT | 61.0 | 89.1 | 164.7 | 95.1 | 92.7 | 113.7 | 119.3 | 125.2 | 131.3 | 137.8 |
| EBIT, % | 9.29 | 12.12 | 22.22 | 13.2 | 11.74 | 13.71 | 13.71 | 13.71 | 13.71 | 13.71 |
| Total Cash | 136.4 | 104.8 | 195.7 | 154.2 | 104.5 | 159.3 | 167.2 | 175.4 | 184.0 | 193.1 |
| Total Cash, percent | .0 | .0 | .0 | .0 | .0 | .0 | .0 | .0 | .0 | .0 |
| Account Receivables | 122.6 | 123.6 | 155.4 | 166.8 | 172.7 | 168.2 | 176.5 | 185.2 | 194.4 | 203.9 |
| Account Receivables, % | 18.69 | 16.81 | 20.97 | 23.14 | 21.86 | 20.29 | 20.29 | 20.29 | 20.29 | 20.29 |
| Inventories | 91.9 | 105.3 | 98.5 | 87.1 | 130.0 | 116.3 | 122.1 | 128.1 | 134.4 | 141.0 |
| Inventories, % | 14 | 14.33 | 13.3 | 12.09 | 16.45 | 14.03 | 14.03 | 14.03 | 14.03 | 14.03 |
| Accounts Payable | 74.8 | 74.5 | 68.6 | 63.4 | 88.0 | 84.1 | 88.2 | 92.6 | 97.1 | 101.9 |
| Accounts Payable, % | 11.39 | 10.13 | 9.26 | 8.79 | 11.14 | 10.14 | 10.14 | 10.14 | 10.14 | 10.14 |
| Capital Expenditure | -21.8 | -23.9 | -24.3 | -20.3 | -28.3 | -26.9 | -28.3 | -29.7 | -31.1 | -32.6 |
| Capital Expenditure, % | -3.31 | -3.25 | -3.28 | -2.82 | -3.59 | -3.25 | -3.25 | -3.25 | -3.25 | -3.25 |
| Tax Rate, % | 18.97 | 18.97 | 18.97 | 18.97 | 18.97 | 18.97 | 18.97 | 18.97 | 18.97 | 18.97 |
| EBITAT | 42.2 | 67.3 | 139.6 | 73.1 | 75.2 | 88.1 | 92.4 | 97.0 | 101.8 | 106.8 |
| Depreciation | ||||||||||
| Changes in Account Receivables | ||||||||||
| Changes in Inventories | ||||||||||
| Changes in Accounts Payable | ||||||||||
| Capital Expenditure | ||||||||||
| UFCF | -88.3 | 56.2 | 111.2 | 74.4 | 58.1 | 109.0 | 89.6 | 94.0 | 98.6 | 103.5 |
| WACC, % | 8.09 | 8.13 | 8.2 | 8.14 | 8.17 | 8.15 | 8.15 | 8.15 | 8.15 | 8.15 |
| PV UFCF | ||||||||||
| SUM PV UFCF | 393.7 | |||||||||
| Long Term Growth Rate, % | 3.00 | |||||||||
| Free cash flow (T + 1) | 107 | |||||||||
| Terminal Value | 2,071 | |||||||||
| Present Terminal Value | 1,400 | |||||||||
| Enterprise Value | 1,794 | |||||||||
| Net Debt | 499 | |||||||||
| Equity Value | 1,294 | |||||||||
| Diluted Shares Outstanding, MM | 12 | |||||||||
| Equity Value Per Share | 107.73 |
What You Will Receive
- Comprehensive Financial Model: Standex International Corporation’s (SXI) actual data provides an accurate DCF valuation.
- Complete Forecast Flexibility: Modify revenue growth, profit margins, WACC, and other critical parameters.
- Real-Time Calculations: Automatic updates allow you to view results instantly as adjustments are made.
- Professional-Grade Template: A polished Excel file crafted for high-quality valuation needs.
- Adaptable and Repeatable: Designed for versatility, enabling ongoing use for in-depth forecasts.
Key Features
- Comprehensive SXI Data: Pre-filled with Standex International Corporation’s historical financials and future projections.
- Fully Customizable Inputs: Modify revenue growth rates, margins, WACC, tax rates, and capital expenditures to suit your analysis.
- Dynamic Valuation Model: Automatic recalculations of Net Present Value (NPV) and intrinsic value based on your customized inputs.
- Scenario Testing: Develop multiple forecasting scenarios to evaluate various valuation outcomes.
- User-Friendly Design: Intuitive, organized, and tailored for both professionals and newcomers.
How It Works
- Download the Template: Gain immediate access to the Excel-based SXI DCF Calculator.
- Input Your Assumptions: Modify the yellow-highlighted cells for growth rates, WACC, margins, and other variables.
- Instant Calculations: The model will automatically refresh to reflect Standex International's intrinsic value.
- Test Scenarios: Experiment with various assumptions to assess potential changes in valuation.
- Analyze and Decide: Utilize the findings to inform your investment or financial strategy.
Why Choose This Calculator for Standex International Corporation (SXI)?
- Designed for Experts: A sophisticated tool utilized by financial analysts, CFOs, and industry consultants.
- Accurate Financial Data: Standex’s historical and projected financials are preloaded for precise calculations.
- Flexible Scenario Analysis: Effortlessly simulate various forecasts and assumptions.
- Comprehensive Outputs: Automatically computes intrinsic value, NPV, and essential financial metrics.
- User-Friendly: Step-by-step guidance ensures a smooth user experience.
Who Should Use Standex International Corporation (SXI)?
- Investors: Gain insights into diverse sectors with a reliable investment analysis platform.
- Financial Analysts: Streamline your workflow with comprehensive financial models tailored for (SXI).
- Consultants: Efficiently modify templates for client engagements or strategic assessments involving (SXI).
- Finance Enthusiasts: Explore investment strategies and market trends related to (SXI) for a richer understanding.
- Educators and Students: Utilize (SXI) as a case study for hands-on learning in finance and investment courses.
What the Template Contains
- Preloaded SXI Data: Historical and projected financial data, including revenue, EBIT, and capital expenditures.
- DCF and WACC Models: Professional-grade sheets for calculating intrinsic value and Weighted Average Cost of Capital.
- Editable Inputs: Yellow-highlighted cells for adjusting revenue growth, tax rates, and discount rates.
- Financial Statements: Comprehensive annual and quarterly financials for deeper analysis.
- Key Ratios: Profitability, leverage, and efficiency ratios to evaluate performance.
- Dashboard and Charts: Visual summaries of valuation outcomes and assumptions.
Disclaimer
All information, articles, and product details provided on this website are for general informational and educational purposes only. We do not claim any ownership over, nor do we intend to infringe upon, any trademarks, copyrights, logos, brand names, or other intellectual property mentioned or depicted on this site. Such intellectual property remains the property of its respective owners, and any references here are made solely for identification or informational purposes, without implying any affiliation, endorsement, or partnership.
We make no representations or warranties, express or implied, regarding the accuracy, completeness, or suitability of any content or products presented. Nothing on this website should be construed as legal, tax, investment, financial, medical, or other professional advice. In addition, no part of this site—including articles or product references—constitutes a solicitation, recommendation, endorsement, advertisement, or offer to buy or sell any securities, franchises, or other financial instruments, particularly in jurisdictions where such activity would be unlawful.
All content is of a general nature and may not address the specific circumstances of any individual or entity. It is not a substitute for professional advice or services. Any actions you take based on the information provided here are strictly at your own risk. You accept full responsibility for any decisions or outcomes arising from your use of this website and agree to release us from any liability in connection with your use of, or reliance upon, the content or products found herein.