
|
Sojoung International Inc. (SY) DCF-Bewertung |
Fully Editable: Tailor To Your Needs In Excel Or Sheets
Professional Design: Trusted, Industry-Standard Templates
Investor-Approved Valuation Models
MAC/PC Compatible, Fully Unlocked
No Expertise Is Needed; Easy To Follow
So-Young International Inc. (SY) Bundle
Möchten Sie den inneren Wert von Sojoung International Inc. bestimmen? Unser Sy DCF-Taschenrechner integriert reale Daten mit umfassenden Anpassungsfunktionen, sodass Sie Ihre Prognosen verfeinern und Ihre Anlagestrategien verbessern können.
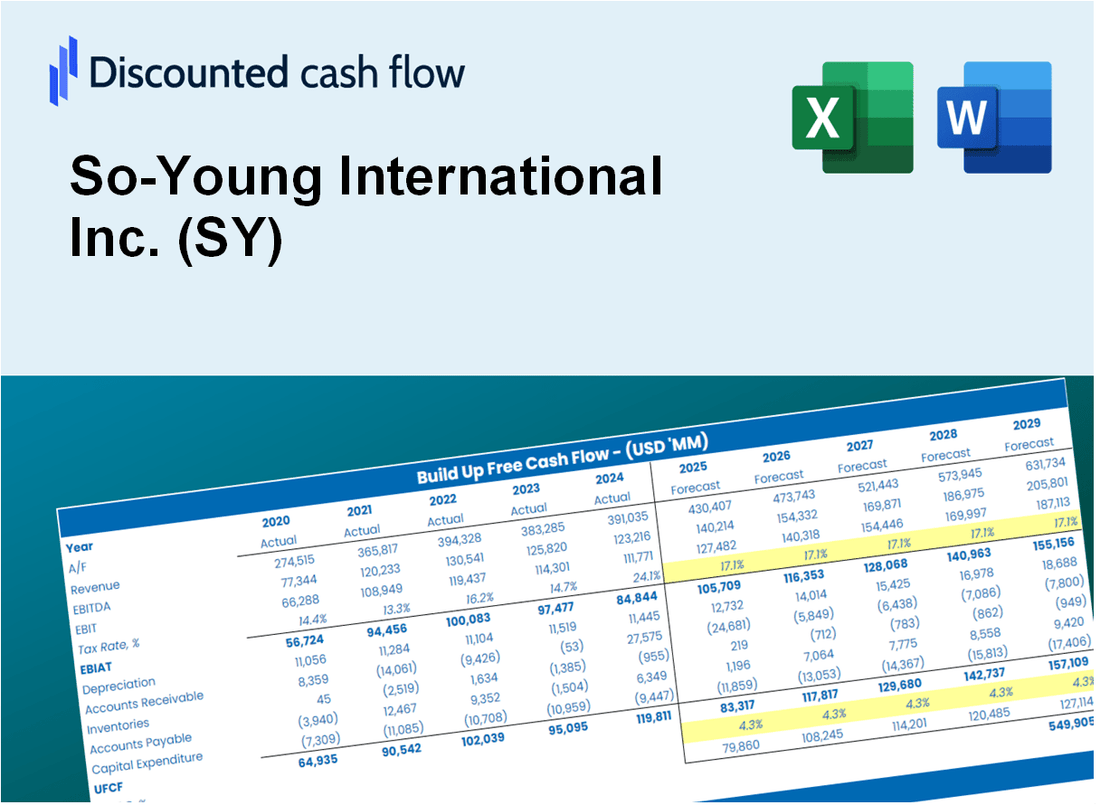
Discounted Cash Flow (DCF) - (USD MM)
| Year | AY1 2020 |
AY2 2021 |
AY3 2022 |
AY4 2023 |
AY5 2024 |
FY1 2025 |
FY2 2026 |
FY3 2027 |
FY4 2028 |
FY5 2029 |
|---|---|---|---|---|---|---|---|---|---|---|
| Revenue | 182.0 | 237.8 | 176.8 | 210.5 | 206.1 | 217.4 | 229.4 | 242.0 | 255.4 | 269.4 |
| Revenue Growth, % | 0 | 30.69 | -25.68 | 19.09 | -2.09 | 5.5 | 5.5 | 5.5 | 5.5 | 5.5 |
| EBITDA | -6.0 | 8.9 | -7.8 | -2.1 | -5.4 | -3.3 | -3.5 | -3.7 | -3.9 | -4.1 |
| EBITDA, % | -3.29 | 3.75 | -4.43 | -0.99845 | -2.62 | -1.52 | -1.52 | -1.52 | -1.52 | -1.52 |
| Depreciation | 2.0 | 4.2 | 6.6 | 6.5 | 6.5 | 5.6 | 5.9 | 6.2 | 6.6 | 6.9 |
| Depreciation, % | 1.09 | 1.78 | 3.74 | 3.08 | 3.14 | 2.57 | 2.57 | 2.57 | 2.57 | 2.57 |
| EBIT | -8.0 | 4.7 | -14.4 | -8.6 | -11.9 | -8.9 | -9.4 | -9.9 | -10.4 | -11.0 |
| EBIT, % | -4.38 | 1.97 | -8.17 | -4.08 | -5.76 | -4.08 | -4.08 | -4.08 | -4.08 | -4.08 |
| Total Cash | 373.0 | 244.6 | 220.7 | 186.5 | 166.8 | 204.2 | 215.4 | 227.3 | 239.8 | 253.0 |
| Total Cash, percent | .0 | .0 | .0 | .0 | .0 | .0 | .0 | .0 | .0 | .0 |
| Account Receivables | 12.0 | 15.5 | 23.9 | 11.3 | 31.8 | 20.6 | 21.8 | 23.0 | 24.2 | 25.6 |
| Account Receivables, % | 6.59 | 6.53 | 13.54 | 5.37 | 15.43 | 9.49 | 9.49 | 9.49 | 9.49 | 9.49 |
| Inventories | 3.1 | 12.9 | 16.9 | 16.7 | 21.3 | 15.2 | 16.0 | 16.9 | 17.9 | 18.8 |
| Inventories, % | 1.69 | 5.42 | 9.58 | 7.94 | 10.35 | 7 | 7 | 7 | 7 | 7 |
| Accounts Payable | .0 | .0 | .0 | .0 | .0 | .0 | .0 | .0 | .0 | .0 |
| Accounts Payable, % | 0 | 0 | 0 | 0 | 0 | 0 | 0 | 0 | 0 | 0 |
| Capital Expenditure | -5.2 | -6.3 | -2.2 | -7.2 | -8.8 | -6.3 | -6.6 | -7.0 | -7.4 | -7.8 |
| Capital Expenditure, % | -2.85 | -2.66 | -1.25 | -3.42 | -4.26 | -2.89 | -2.89 | -2.89 | -2.89 | -2.89 |
| Tax Rate, % | -0.24486 | -0.24486 | -0.24486 | -0.24486 | -0.24486 | -0.24486 | -0.24486 | -0.24486 | -0.24486 | -0.24486 |
| EBITAT | -497.4 | 2.4 | -10.9 | -23.2 | -11.9 | -7.6 | -8.0 | -8.4 | -8.9 | -9.4 |
| Depreciation | ||||||||||
| Changes in Account Receivables | ||||||||||
| Changes in Inventories | ||||||||||
| Changes in Accounts Payable | ||||||||||
| Capital Expenditure | ||||||||||
| UFCF | -515.7 | -13.1 | -18.9 | -11.1 | -39.3 | 9.0 | -10.7 | -11.3 | -11.9 | -12.6 |
| WACC, % | 12.74 | 12.65 | 12.7 | 12.74 | 12.74 | 12.72 | 12.72 | 12.72 | 12.72 | 12.72 |
| PV UFCF | ||||||||||
| SUM PV UFCF | -22.6 | |||||||||
| Long Term Growth Rate, % | 2.00 | |||||||||
| Free cash flow (T + 1) | -13 | |||||||||
| Terminal Value | -120 | |||||||||
| Present Terminal Value | -66 | |||||||||
| Enterprise Value | -88 | |||||||||
| Net Debt | -49 | |||||||||
| Equity Value | -39 | |||||||||
| Diluted Shares Outstanding, MM | 174 | |||||||||
| Equity Value Per Share | -0.23 |
What You Will Get
- Editable Forecast Inputs: Easily modify key assumptions (growth %, margins, WACC) to explore various scenarios.
- Real-World Data: So-Young International Inc.’s (SY) financial data pre-loaded to kickstart your analysis.
- Automatic DCF Outputs: The template computes Net Present Value (NPV) and intrinsic value automatically.
- Customizable and Professional: A refined Excel model tailored to meet your valuation requirements.
- Built for Analysts and Investors: Perfect for assessing projections, validating strategies, and enhancing efficiency.
Key Features
- Customizable Growth Metrics: Adjust essential inputs such as user growth, revenue per user, and marketing expenses.
- Instant DCF Valuation: Quickly computes intrinsic value, NPV, and additional financial metrics.
- High-Precision Accuracy: Leverages So-Young’s real-world financial data for credible valuation results.
- Simplified Scenario Testing: Easily experiment with various assumptions and analyze the resulting impacts.
- Efficient Valuation Tool: Avoid the hassle of constructing intricate valuation models from the ground up.
How It Works
- Step 1: Download the Excel file.
- Step 2: Review So-Young International Inc.'s pre-filled financial data and forecasts.
- Step 3: Modify critical inputs like revenue growth, WACC, and tax rates (highlighted cells).
- Step 4: Watch the DCF model update instantly as you tweak assumptions.
- Step 5: Analyze the outputs and use the results for investment decisions regarding So-Young International Inc. (SY).
Why Choose So-Young International Inc. (SY)?
- Streamlined Experience: Access comprehensive services without the hassle of extensive setup.
- Enhanced Reliability: Utilize accurate data and insights to minimize risk in your investments.
- Fully Adaptable: Customize your approach to align with your financial goals and market outlook.
- User-Friendly Interface: Intuitive design ensures that all information is easy to understand and utilize.
- Endorsed by Professionals: A trusted choice among experts who prioritize quality and effectiveness.
Who Should Use This Product?
- Investors: Accurately estimate So-Young International Inc.'s (SY) fair value before making investment decisions.
- CFOs: Utilize a professional-grade DCF model for financial reporting and analysis related to So-Young International Inc. (SY).
- Consultants: Quickly customize the template for valuation reports tailored to clients interested in So-Young International Inc. (SY).
- Entrepreneurs: Acquire insights into financial modeling practices employed by leading companies like So-Young International Inc. (SY).
- Educators: Implement it as a teaching resource to illustrate valuation methodologies using So-Young International Inc. (SY) as a case study.
What the Template Contains
- Pre-Filled DCF Model: So-Young International Inc.'s (SY) financial data preloaded for immediate use.
- WACC Calculator: Detailed calculations for Weighted Average Cost of Capital.
- Financial Ratios: Evaluate So-Young International Inc.'s (SY) profitability, leverage, and efficiency.
- Editable Inputs: Change assumptions such as growth, margins, and CAPEX to fit your scenarios.
- Financial Statements: Annual and quarterly reports to support detailed analysis.
- Interactive Dashboard: Easily visualize key valuation metrics and results.
Disclaimer
All information, articles, and product details provided on this website are for general informational and educational purposes only. We do not claim any ownership over, nor do we intend to infringe upon, any trademarks, copyrights, logos, brand names, or other intellectual property mentioned or depicted on this site. Such intellectual property remains the property of its respective owners, and any references here are made solely for identification or informational purposes, without implying any affiliation, endorsement, or partnership.
We make no representations or warranties, express or implied, regarding the accuracy, completeness, or suitability of any content or products presented. Nothing on this website should be construed as legal, tax, investment, financial, medical, or other professional advice. In addition, no part of this site—including articles or product references—constitutes a solicitation, recommendation, endorsement, advertisement, or offer to buy or sell any securities, franchises, or other financial instruments, particularly in jurisdictions where such activity would be unlawful.
All content is of a general nature and may not address the specific circumstances of any individual or entity. It is not a substitute for professional advice or services. Any actions you take based on the information provided here are strictly at your own risk. You accept full responsibility for any decisions or outcomes arising from your use of this website and agree to release us from any liability in connection with your use of, or reliance upon, the content or products found herein.