
|
Syensqo SA/NV (Syens.BR) DCF -Bewertung |
Fully Editable: Tailor To Your Needs In Excel Or Sheets
Professional Design: Trusted, Industry-Standard Templates
Investor-Approved Valuation Models
MAC/PC Compatible, Fully Unlocked
No Expertise Is Needed; Easy To Follow
Syensqo SA/NV (SYENS.BR) Bundle
Entdecken Sie den tatsächlichen Wert von Syensqo SA/NV mit unserem DCF-Taschenrechner von Professional Grade! Passen Sie die wichtigsten Annahmen an, erkunden Sie verschiedene Szenarien und untersuchen, wie Veränderungen die Syensqo SA/NV -Bewertung beeinflussen - alles innerhalb einer einzigen Excel -Vorlage.
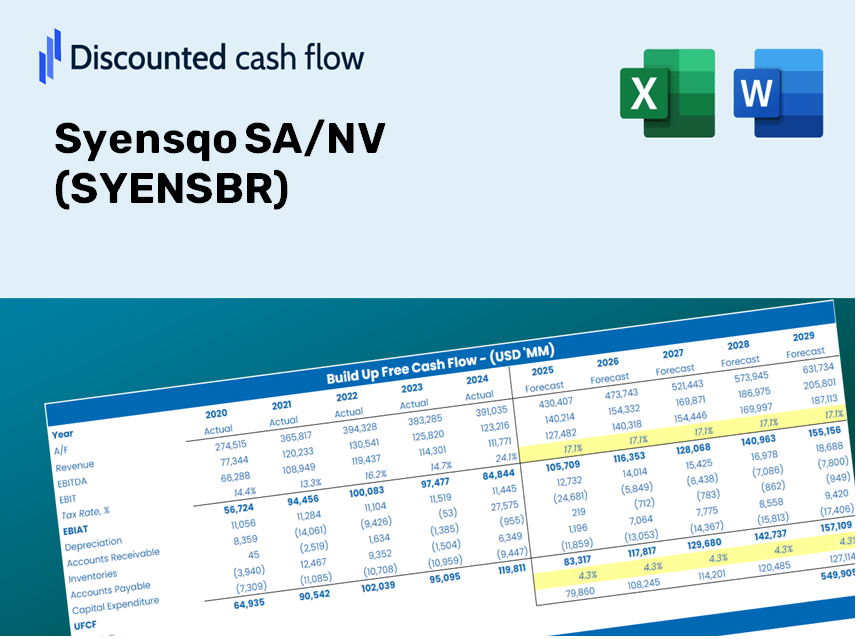
Discounted Cash Flow (DCF) - (USD MM)
| Year | AY1 2020 |
AY2 2021 |
AY3 2022 |
AY4 2023 |
AY5 2024 |
FY1 2025 |
FY2 2026 |
FY3 2027 |
FY4 2028 |
FY5 2029 |
|---|---|---|---|---|---|---|---|---|---|---|
| Revenue | 5,381.0 | 6,032.0 | 8,123.0 | 7,065.0 | 6,846.0 | 7,370.4 | 7,934.9 | 8,542.7 | 9,197.1 | 9,901.5 |
| Revenue Growth, % | 0 | 12.1 | 34.67 | -13.02 | -3.1 | 7.66 | 7.66 | 7.66 | 7.66 | 7.66 |
| EBITDA | -317.0 | 1,171.0 | 1,720.0 | 1,173.0 | 1,215.0 | 1,017.8 | 1,095.8 | 1,179.7 | 1,270.1 | 1,367.3 |
| EBITDA, % | -5.89 | 19.41 | 21.17 | 16.6 | 17.75 | 13.81 | 13.81 | 13.81 | 13.81 | 13.81 |
| Depreciation | 642.0 | 583.0 | 621.0 | 619.0 | 732.0 | 717.8 | 772.8 | 832.0 | 895.7 | 964.3 |
| Depreciation, % | 11.93 | 9.67 | 7.64 | 8.76 | 10.69 | 9.74 | 9.74 | 9.74 | 9.74 | 9.74 |
| EBIT | -959.0 | 588.0 | 1,099.0 | 554.0 | 483.0 | 300.0 | 323.0 | 347.7 | 374.4 | 403.0 |
| EBIT, % | -17.82 | 9.75 | 13.53 | 7.84 | 7.06 | 4.07 | 4.07 | 4.07 | 4.07 | 4.07 |
| Total Cash | 268.0 | 207.0 | 297.0 | 1,224.0 | 739.0 | 592.4 | 637.8 | 686.6 | 739.2 | 795.8 |
| Total Cash, percent | .0 | .0 | .0 | .0 | .0 | .0 | .0 | .0 | .0 | .0 |
| Account Receivables | 2,093.0 | 2,627.0 | 3,010.0 | -45.0 | 1,245.0 | 2,020.2 | 2,175.0 | 2,341.6 | 2,520.9 | 2,714.0 |
| Account Receivables, % | 38.9 | 43.55 | 37.06 | -0.63694 | 18.19 | 27.41 | 27.41 | 27.41 | 27.41 | 27.41 |
| Inventories | 799.0 | 1,149.0 | 1,393.0 | 1,288.0 | 1,273.0 | 1,295.3 | 1,394.5 | 1,501.3 | 1,616.3 | 1,740.1 |
| Inventories, % | 14.85 | 19.05 | 17.15 | 18.23 | 18.59 | 17.57 | 17.57 | 17.57 | 17.57 | 17.57 |
| Accounts Payable | 560.0 | 845.0 | 972.0 | 918.0 | 1,001.0 | 943.4 | 1,015.6 | 1,093.4 | 1,177.2 | 1,267.3 |
| Accounts Payable, % | 10.41 | 14.01 | 11.97 | 12.99 | 14.62 | 12.8 | 12.8 | 12.8 | 12.8 | 12.8 |
| Capital Expenditure | -317.0 | -402.0 | -591.0 | -850.0 | -624.0 | -604.0 | -650.3 | -700.1 | -753.7 | -811.5 |
| Capital Expenditure, % | -5.89 | -6.66 | -7.28 | -12.03 | -9.11 | -8.2 | -8.2 | -8.2 | -8.2 | -8.2 |
| Tax Rate, % | 101.42 | 101.42 | 101.42 | 101.42 | 101.42 | 101.42 | 101.42 | 101.42 | 101.42 | 101.42 |
| EBITAT | -1,103.2 | 550.8 | 1,080.8 | 274.9 | -6.9 | 205.0 | 220.7 | 237.6 | 255.8 | 275.4 |
| Depreciation | ||||||||||
| Changes in Account Receivables | ||||||||||
| Changes in Inventories | ||||||||||
| Changes in Accounts Payable | ||||||||||
| Capital Expenditure | ||||||||||
| UFCF | -3,110.2 | 132.8 | 610.8 | 3,149.9 | -1,090.9 | -536.4 | 161.5 | 173.8 | 187.1 | 201.5 |
| WACC, % | 11.7 | 11.62 | 11.68 | 11.01 | 10.34 | 11.27 | 11.27 | 11.27 | 11.27 | 11.27 |
| PV UFCF | ||||||||||
| SUM PV UFCF | 14.7 | |||||||||
| Long Term Growth Rate, % | 2.00 | |||||||||
| Free cash flow (T + 1) | 206 | |||||||||
| Terminal Value | 2,217 | |||||||||
| Present Terminal Value | 1,300 | |||||||||
| Enterprise Value | 1,314 | |||||||||
| Net Debt | 1,456 | |||||||||
| Equity Value | -142 | |||||||||
| Diluted Shares Outstanding, MM | 105 | |||||||||
| Equity Value Per Share | -1.35 |
What You Will Receive
- Genuine SYENSBR Financial Data: Equipped with Syensqo SA/NV’s historical and projected financial figures for accurate analysis.
- Completely Editable Template: Easily adjust key variables such as revenue growth, WACC, and EBITDA percentage.
- Instant Calculations: Observe real-time updates of Syensqo’s intrinsic value as you make adjustments.
- Professional Valuation Tool: Tailored for investors, analysts, and consultants who require precise DCF results.
- User-Friendly Layout: Intuitive design and straightforward guidelines suitable for all skill levels.
Key Features
- Customizable Forecast Inputs: Adjust essential metrics such as revenue growth, EBITDA %, and capital investments.
- Instant DCF Valuation: Computes intrinsic value, NPV, and additional metrics in real-time.
- Industry-Leading Accuracy: Leverages Syensqo SA/NV’s (SYENSBR) actual financial data for credible valuation results.
- Simplified Scenario Analysis: Experiment with various assumptions and effortlessly compare results.
- Efficiency Boost: Save time by avoiding the construction of intricate valuation models from the ground up.
How It Works
- Download the Template: Gain immediate access to the Excel-based SYENSBR DCF Calculator.
- Input Your Assumptions: Modify the yellow-highlighted cells for growth rates, WACC, margins, and additional variables.
- Instant Calculations: The model swiftly recalculates Syensqo’s intrinsic value.
- Test Scenarios: Experiment with various assumptions to assess potential changes in valuation.
- Analyze and Decide: Leverage the results to inform your investment or financial evaluations.
Why Choose the Syensqo Calculator?
- All-in-One Solution: Integrates DCF, WACC, and financial ratio analyses seamlessly.
- Flexible Inputs: Modify the highlighted cells to explore different financial scenarios.
- In-Depth Analysis: Automatically computes the intrinsic value and Net Present Value for Syensqo (SYENSBR).
- Ready-to-Use Data: Comes with historical and projected data for reliable analyses.
- High-Quality Standards: Perfectly suited for financial analysts, investors, and business advisors.
Who Can Benefit from Syensqo SA/NV (SYENSBR)?
- Investors: Gain insights into informed decision-making with a top-tier valuation tool.
- Financial Analysts: Streamline your analysis with a customizable, ready-to-use DCF model.
- Consultants: Effortlessly modify the template for client reports or presentations.
- Finance Enthusiasts: Enhance your grasp of valuation methods through practical examples.
- Educators and Students: Utilize this resource as a hands-on learning aid in finance courses.
Contents of the Template
- Historical Data: Contains Syensqo SA/NV’s past financial information and foundational forecasts.
- DCF and Levered DCF Models: Comprehensive templates for determining the intrinsic value of Syensqo SA/NV.
- WACC Sheet: Pre-configured calculations for the Weighted Average Cost of Capital.
- Editable Inputs: Adjust key variables such as growth rates, EBITDA percentages, and CAPEX assumptions.
- Quarterly and Annual Statements: A thorough overview of Syensqo SA/NV’s financials.
- Interactive Dashboard: Dynamically visualize valuation results and forecasts.
Disclaimer
All information, articles, and product details provided on this website are for general informational and educational purposes only. We do not claim any ownership over, nor do we intend to infringe upon, any trademarks, copyrights, logos, brand names, or other intellectual property mentioned or depicted on this site. Such intellectual property remains the property of its respective owners, and any references here are made solely for identification or informational purposes, without implying any affiliation, endorsement, or partnership.
We make no representations or warranties, express or implied, regarding the accuracy, completeness, or suitability of any content or products presented. Nothing on this website should be construed as legal, tax, investment, financial, medical, or other professional advice. In addition, no part of this site—including articles or product references—constitutes a solicitation, recommendation, endorsement, advertisement, or offer to buy or sell any securities, franchises, or other financial instruments, particularly in jurisdictions where such activity would be unlawful.
All content is of a general nature and may not address the specific circumstances of any individual or entity. It is not a substitute for professional advice or services. Any actions you take based on the information provided here are strictly at your own risk. You accept full responsibility for any decisions or outcomes arising from your use of this website and agree to release us from any liability in connection with your use of, or reliance upon, the content or products found herein.