
|
Syngene International Limited (Syngen.NS) DCF -Bewertung |
Fully Editable: Tailor To Your Needs In Excel Or Sheets
Professional Design: Trusted, Industry-Standard Templates
Investor-Approved Valuation Models
MAC/PC Compatible, Fully Unlocked
No Expertise Is Needed; Easy To Follow
Syngene International Limited (SYNGENE.NS) Bundle
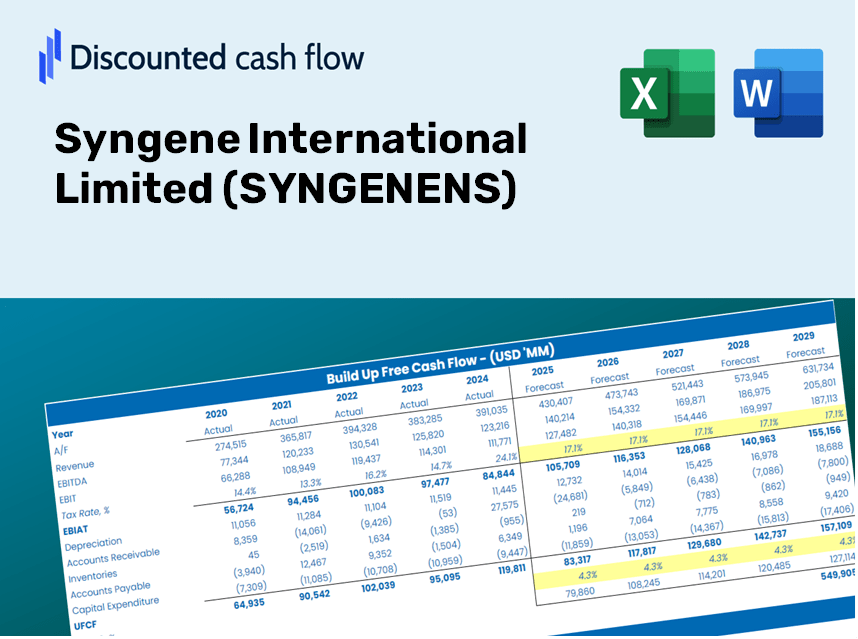
Unabhängig davon, ob Sie ein Anleger oder Analyst sind, ist dieser (Syngenens) DCF-Taschenrechner Ihr Anlaufwerk für eine genaue Bewertung. Mit realen Daten von Syngene International Limited geladen, können Sie Prognosen anpassen und die Auswirkungen in Echtzeit beobachten.
Benefits You Will Receive
- Accurate SYNG Financials: Access to historical and projected data for precise valuation.
- Customizable Inputs: Adjust parameters such as WACC, tax rates, revenue growth, and capital expenditures.
- Instant Calculations: Intrinsic value and NPV are computed automatically.
- Scenario Analysis: Evaluate various scenarios to assess the future performance of Syngene International.
- User-Friendly Interface: Designed for professionals while remaining approachable for newcomers.
Essential Features
- Customizable Forecast Inputs: Adjust key factors such as revenue growth, EBITDA %, and capital expenditures.
- Instant DCF Valuation: Automatically determines intrinsic value, NPV, and additional outputs in real-time.
- High-Precision Accuracy: Utilizes Syngene's real-world financial data for credible valuation results.
- Streamlined Scenario Analysis: Effortlessly explore various assumptions and evaluate different outcomes.
- Efficient Valuation Solution: Remove the hassle of constructing intricate valuation models from the ground up.
How It Operates
- Step 1: Download the prebuilt Excel template that includes data for Syngene International Limited (SYNGENENS).
- Step 2: Navigate through the pre-filled sheets to familiarize yourself with the essential metrics.
- Step 3: Modify forecasts and assumptions in the editable yellow cells (WACC, growth, margins).
- Step 4: Instantly see the updated results, including the intrinsic value of Syngene International Limited (SYNGENENS).
- Step 5: Make well-informed investment choices or create reports based on the generated outputs.
Why Choose This Calculator for Syngene International Limited (SYNGENENS)?
- Precision: Utilizes real Syngene financial data to ensure reliable results.
- Customization: Built for users to easily adjust and test various inputs.
- Efficiency: Avoid the complexity of creating a DCF model from the ground up.
- Expert-Level: Crafted with the standards of CFOs for accuracy and practicality.
- Intuitive: Simple to navigate, even for those with limited financial modeling skills.
Who Can Benefit from This Product?
- Finance Students: Master valuation methodologies and practice with real-world data.
- Researchers: Integrate established models into your academic projects and studies.
- Investors: Evaluate your hypotheses and assess valuation results for Syngene International Limited (SYNGENENS) stock.
- Market Analysts: Enhance your efficiency with a ready-to-use, customizable DCF model.
- Entrepreneurs: Discover the analytical approaches used for evaluating major public companies like Syngene International Limited (SYNGENENS).
Contents of the Template
- Operating and Balance Sheet Data: Pre-filled historical data and forecasts for Syngene International Limited (SYNGENENS), including metrics such as revenue, EBITDA, EBIT, and capital expenditures.
- WACC Calculation: A dedicated sheet for calculating the Weighted Average Cost of Capital (WACC), featuring essential parameters like Beta, the risk-free rate, and share price.
- DCF Valuation (Unlevered and Levered): Customizable Discounted Cash Flow models that present intrinsic value alongside comprehensive calculations.
- Financial Statements: Pre-loaded annual and quarterly financial statements to facilitate thorough analysis.
- Key Ratios: A collection of profitability, leverage, and efficiency ratios specific to Syngene International Limited (SYNGENENS).
- Dashboard and Charts: A visual overview of valuation outcomes and assumptions for straightforward results analysis.
Disclaimer
All information, articles, and product details provided on this website are for general informational and educational purposes only. We do not claim any ownership over, nor do we intend to infringe upon, any trademarks, copyrights, logos, brand names, or other intellectual property mentioned or depicted on this site. Such intellectual property remains the property of its respective owners, and any references here are made solely for identification or informational purposes, without implying any affiliation, endorsement, or partnership.
We make no representations or warranties, express or implied, regarding the accuracy, completeness, or suitability of any content or products presented. Nothing on this website should be construed as legal, tax, investment, financial, medical, or other professional advice. In addition, no part of this site—including articles or product references—constitutes a solicitation, recommendation, endorsement, advertisement, or offer to buy or sell any securities, franchises, or other financial instruments, particularly in jurisdictions where such activity would be unlawful.
All content is of a general nature and may not address the specific circumstances of any individual or entity. It is not a substitute for professional advice or services. Any actions you take based on the information provided here are strictly at your own risk. You accept full responsibility for any decisions or outcomes arising from your use of this website and agree to release us from any liability in connection with your use of, or reliance upon, the content or products found herein.