
|
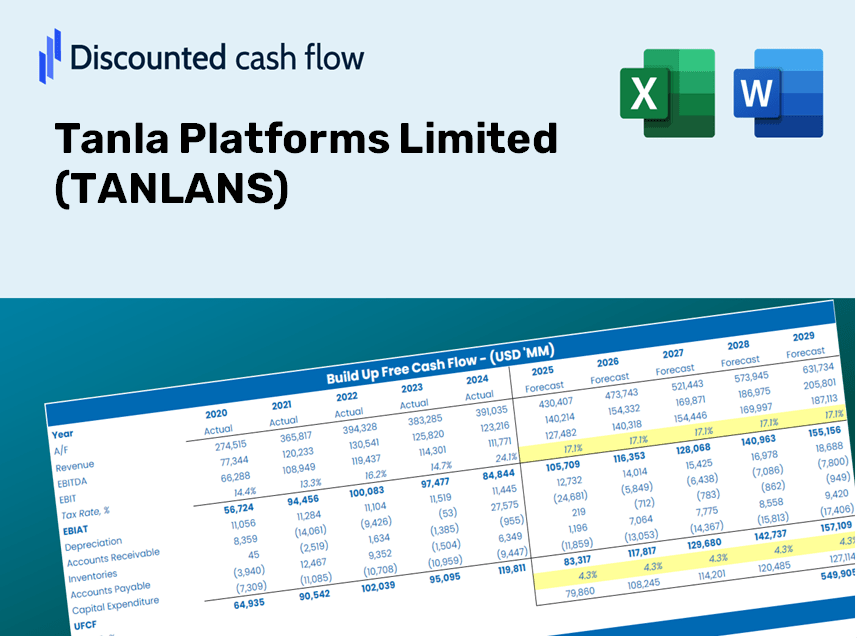
Tanla Plattformen Limited (Tanla.NS) DCF -Bewertung |
Fully Editable: Tailor To Your Needs In Excel Or Sheets
Professional Design: Trusted, Industry-Standard Templates
Investor-Approved Valuation Models
MAC/PC Compatible, Fully Unlocked
No Expertise Is Needed; Easy To Follow
Tanla Platforms Limited (TANLA.NS) Bundle
Möchten Sie den inneren Wert von Tanla -Plattformen beurteilen? Unser (Tanlans) DCF-Taschenrechner integriert reale Daten mit umfassenden Anpassungsfunktionen, sodass Sie Ihre Prognosen verfeinern und Ihre Anlageentscheidungen verbessern können.
What You Will Receive
- Customizable Excel Template: A complete Excel-based DCF Calculator featuring pre-populated financial data for Tanla Platforms Limited (TANLANS).
- Actual Market Data: Access to historical figures and future estimates (highlighted in the yellow cells).
- Adjustable Projections: Modify forecast parameters such as revenue growth, EBITDA margin, and WACC.
- Instant Calculations: See the effects of your inputs on Tanla's valuation immediately.
- Professional-Grade Tool: Designed for investors, CFOs, consultants, and financial analysts.
- User-Friendly Interface: Organized for clarity and simplicity, complete with step-by-step guidance.
Key Features
- 🔍 Real-Time TANLANS Financials: Pre-filled historical and projected data for Tanla Platforms Limited.
- ✏️ Fully Customizable Inputs: Modify all essential parameters (yellow cells) including WACC, growth %, and tax rates.
- 📊 Professional DCF Valuation: Integrated formulas compute Tanla's intrinsic value using the Discounted Cash Flow method.
- ⚡ Instant Results: Visualize Tanla's valuation immediately after making adjustments.
- Scenario Analysis: Evaluate and compare outcomes for different financial assumptions side-by-side.
How It Functions
- Download the Template: Gain immediate access to the Excel-based TANLANS DCF Calculator.
- Input Your Assumptions: Customize the yellow-highlighted cells for growth rates, WACC, margins, and other variables.
- Instant Calculations: The model automatically provides updates on Tanla Platforms Limited's intrinsic value.
- Test Scenarios: Explore various assumptions to assess potential changes in valuation.
- Analyze and Decide: Utilize the outcomes to inform your investment or financial analysis.
Why Choose This Calculator for Tanla Platforms Limited (TANLANS)?
- Precise Data: Utilize real financial metrics from Tanla Platforms for trustworthy valuation outcomes.
- Adaptable: Tailor essential parameters such as growth rates, WACC, and tax rates to align with your forecasts.
- Efficiency: Pre-existing calculations save you the hassle of starting anew.
- Expert-Level Tool: Crafted for investors, analysts, and consultants working with Tanla Platforms.
- Easy to Use: A user-friendly design and clear instructions guide users effortlessly through the process.
Who Can Benefit from Tanla Platforms Limited (TANLANS)?
- Investors: Empower your investment choices with our advanced valuation tools tailored for precision.
- Financial Analysts: Streamline your workflow with a customizable DCF model designed for efficiency.
- Consultants: Effortlessly modify our templates for impactful client presentations and comprehensive reports.
- Finance Enthusiasts: Enhance your knowledge of valuation methods through practical, real-world scenarios.
- Educators and Students: Utilize our resources as effective educational aids for finance-related disciplines.
Contents of the Template
- Pre-Filled Data: Contains Tanla Platforms Limited's historical financials and projections.
- Discounted Cash Flow Model: Editable DCF valuation model featuring automated calculations.
- Weighted Average Cost of Capital (WACC): A dedicated worksheet for WACC computations based on user-defined inputs.
- Key Financial Ratios: Assess Tanla Platforms Limited's profitability, efficiency, and leverage metrics.
- Customizable Inputs: Easily modify assumptions for revenue growth, profit margins, and tax rates.
- Clear Dashboard: Visual representations and tables summarizing critical valuation outcomes.
Disclaimer
All information, articles, and product details provided on this website are for general informational and educational purposes only. We do not claim any ownership over, nor do we intend to infringe upon, any trademarks, copyrights, logos, brand names, or other intellectual property mentioned or depicted on this site. Such intellectual property remains the property of its respective owners, and any references here are made solely for identification or informational purposes, without implying any affiliation, endorsement, or partnership.
We make no representations or warranties, express or implied, regarding the accuracy, completeness, or suitability of any content or products presented. Nothing on this website should be construed as legal, tax, investment, financial, medical, or other professional advice. In addition, no part of this site—including articles or product references—constitutes a solicitation, recommendation, endorsement, advertisement, or offer to buy or sell any securities, franchises, or other financial instruments, particularly in jurisdictions where such activity would be unlawful.
All content is of a general nature and may not address the specific circumstances of any individual or entity. It is not a substitute for professional advice or services. Any actions you take based on the information provided here are strictly at your own risk. You accept full responsibility for any decisions or outcomes arising from your use of this website and agree to release us from any liability in connection with your use of, or reliance upon, the content or products found herein.