
|
Tactile Systems Technology, Inc. (TCMD) DCF -Bewertung |
Fully Editable: Tailor To Your Needs In Excel Or Sheets
Professional Design: Trusted, Industry-Standard Templates
Investor-Approved Valuation Models
MAC/PC Compatible, Fully Unlocked
No Expertise Is Needed; Easy To Follow
Tactile Systems Technology, Inc. (TCMD) Bundle
Entdecken Sie den tatsächlichen Wert von Tactile Systems Technology, Inc. (TCMD) mit unserem erweiterten DCF -Taschenrechner! Passen Sie die wichtigsten Annahmen an, erkunden Sie verschiedene Szenarien und bewerten Sie, wie Änderungen die Bewertung der Tactile Systems Technology, Inc. (TCMD) beeinflussen-alles innerhalb einer benutzerfreundlichen Excel-Vorlage.
What You Will Get
- Editable Excel Template: A fully customizable Excel-based DCF Calculator featuring pre-filled real TCMD financials.
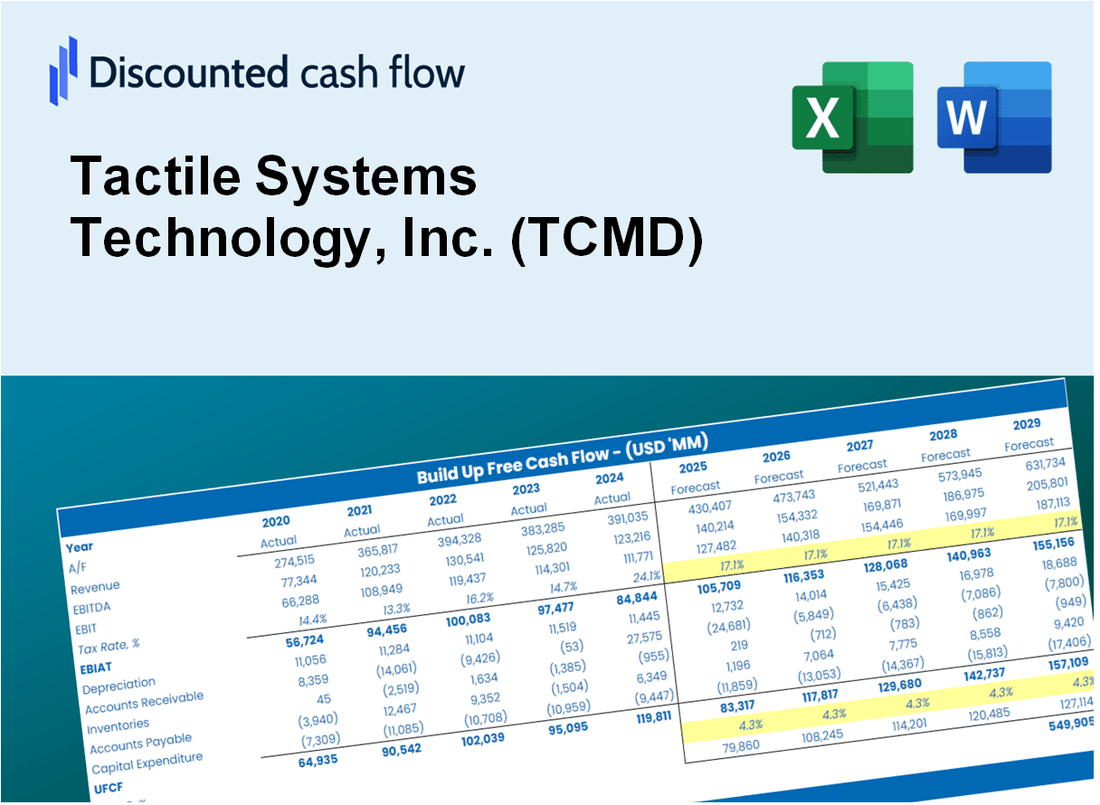
- Real-World Data: Historical data and forward-looking estimates (as highlighted in the yellow cells).
- Forecast Flexibility: Modify forecast assumptions such as revenue growth, EBITDA %, and WACC.
- Automatic Calculations: Instantly observe the effect of your inputs on Tactile Systems Technology’s valuation.
- Professional Tool: Designed for investors, CFOs, consultants, and financial analysts.
- User-Friendly Design: Organized for clarity and ease of use, complete with step-by-step instructions.
Key Features
- Customizable Financial Inputs: Adjust essential metrics such as revenue growth, EBITDA margin, and capital investments.
- Instant DCF Valuation: Quickly computes intrinsic value, NPV, and other financial metrics.
- High-Precision Accuracy: Incorporates Tactile Systems Technology’s actual financial data for dependable valuation results.
- Effortless Scenario Analysis: Easily explore various assumptions and analyze different outcomes.
- Efficiency Booster: Remove the hassle of constructing intricate valuation models from the ground up.
How It Works
- Download: Obtain the pre-built Excel file featuring Tactile Systems Technology, Inc.'s (TCMD) financial data.
- Customize: Modify projections, including revenue growth, EBITDA %, and WACC.
- Update Automatically: The intrinsic value and NPV calculations refresh in real-time.
- Test Scenarios: Develop various forecasts and compare results instantly.
- Make Decisions: Leverage the valuation outcomes to inform your investment approach.
Why Choose This Calculator for Tactile Systems Technology, Inc. (TCMD)?
- User-Friendly Interface: Perfectly crafted for both newcomers and seasoned professionals.
- Customizable Inputs: Adjust parameters effortlessly to suit your financial analysis.
- Real-Time Valuation: Monitor immediate updates to Tactile Systems Technology’s valuation with every input change.
- Pre-Configured Data: Comes loaded with Tactile Systems Technology’s actual financial metrics for swift evaluations.
- Relied Upon by Experts: Favored by investors and analysts for making well-informed choices.
Who Should Use This Product?
- Investors: Assess Tactile Systems Technology, Inc.'s (TCMD) valuation before making investment decisions.
- CFOs and Financial Analysts: Optimize valuation methodologies and evaluate financial forecasts.
- Startup Founders: Understand the valuation metrics of established companies like Tactile Systems Technology, Inc. (TCMD).
- Consultants: Provide comprehensive valuation analyses for client projects.
- Students and Educators: Utilize current data to enhance learning and application of valuation strategies.
What the Template Contains
- Pre-Filled Data: Includes Tactile Systems Technology, Inc.'s (TCMD) historical financials and forecasts.
- Discounted Cash Flow Model: Editable DCF valuation model with automatic calculations.
- Weighted Average Cost of Capital (WACC): A dedicated sheet for calculating WACC based on custom inputs.
- Key Financial Ratios: Analyze Tactile Systems Technology, Inc.'s (TCMD) profitability, efficiency, and leverage.
- Customizable Inputs: Edit revenue growth, margins, and tax rates with ease.
- Clear Dashboard: Charts and tables summarizing key valuation results.
Disclaimer
All information, articles, and product details provided on this website are for general informational and educational purposes only. We do not claim any ownership over, nor do we intend to infringe upon, any trademarks, copyrights, logos, brand names, or other intellectual property mentioned or depicted on this site. Such intellectual property remains the property of its respective owners, and any references here are made solely for identification or informational purposes, without implying any affiliation, endorsement, or partnership.
We make no representations or warranties, express or implied, regarding the accuracy, completeness, or suitability of any content or products presented. Nothing on this website should be construed as legal, tax, investment, financial, medical, or other professional advice. In addition, no part of this site—including articles or product references—constitutes a solicitation, recommendation, endorsement, advertisement, or offer to buy or sell any securities, franchises, or other financial instruments, particularly in jurisdictions where such activity would be unlawful.
All content is of a general nature and may not address the specific circumstances of any individual or entity. It is not a substitute for professional advice or services. Any actions you take based on the information provided here are strictly at your own risk. You accept full responsibility for any decisions or outcomes arising from your use of this website and agree to release us from any liability in connection with your use of, or reliance upon, the content or products found herein.