
|
Tscan Therapeutics, Inc. (TCRX) DCF -Bewertung |
Fully Editable: Tailor To Your Needs In Excel Or Sheets
Professional Design: Trusted, Industry-Standard Templates
Investor-Approved Valuation Models
MAC/PC Compatible, Fully Unlocked
No Expertise Is Needed; Easy To Follow
TScan Therapeutics, Inc. (TCRX) Bundle
Verbessern Sie Ihre Investitionsauswahl mit dem DCF -Theraper Therapeutics, Inc. (TCRx) TCAN! Erforschen Sie reale Finanzdaten, passen Sie Wachstumsprognosen und -kosten an und visualisieren Sie sofort, wie sich diese Veränderungen auf den inneren Wert von TSCAN Therapeutics, Inc. (TCRX) auswirken.
What You Will Get
- Editable Forecast Inputs: Easily modify key assumptions (growth %, margins, WACC) to explore various scenarios.
- Real-World Data: TScan Therapeutics, Inc.'s (TCRX) financial data pre-filled to facilitate your analysis.
- Automatic DCF Outputs: The template automatically calculates Net Present Value (NPV) and intrinsic value for your convenience.
- Customizable and Professional: A sleek Excel model designed to meet your valuation requirements.
- Built for Analysts and Investors: Perfect for assessing projections, validating strategies, and enhancing efficiency.
Key Features
- Comprehensive TCRX Data: Pre-loaded with TScan Therapeutics’ historical performance metrics and future growth projections.
- Highly Customizable Variables: Modify assumptions on revenue growth, profit margins, discount rates, tax implications, and capital investments.
- Interactive Valuation Framework: Instantly recalculates Net Present Value (NPV) and intrinsic value based on your specified parameters.
- Multiple Scenario Analysis: Develop various forecasting scenarios to explore different valuation results.
- Intuitive User Interface: Designed for ease of use, catering to both industry experts and newcomers.
How It Works
- Download the Template: Gain immediate access to the Excel-based TScan Therapeutics, Inc. (TCRX) DCF Calculator.
- Input Your Assumptions: Modify the yellow-highlighted cells for growth rates, WACC, margins, and other variables.
- Instant Calculations: The model will automatically refresh TScan’s intrinsic value.
- Test Scenarios: Experiment with different assumptions to assess potential changes in valuation.
- Analyze and Decide: Utilize the outcomes to inform your investment or financial strategy.
Why Choose This Calculator?
- Accurate Data: Real TScan Therapeutics financials ensure reliable valuation results.
- Customizable: Adjust key parameters like growth rates, WACC, and tax rates to match your projections.
- Time-Saving: Pre-built calculations eliminate the need to start from scratch.
- Professional-Grade Tool: Designed for investors, analysts, and consultants.
- User-Friendly: Intuitive layout and step-by-step instructions make it easy for all users.
Who Should Use This Product?
- Individual Investors: Make informed decisions about buying or selling TScan Therapeutics, Inc. (TCRX) stock.
- Financial Analysts: Streamline valuation processes with ready-to-use financial models specific to TScan Therapeutics, Inc. (TCRX).
- Consultants: Provide clients with professional valuation insights on TScan Therapeutics, Inc. (TCRX) swiftly and accurately.
- Business Owners: Gain insights into how biotech companies like TScan Therapeutics, Inc. (TCRX) are valued to inform your own business strategy.
- Finance Students: Explore valuation techniques using real-world data and scenarios related to TScan Therapeutics, Inc. (TCRX).
What the Template Contains
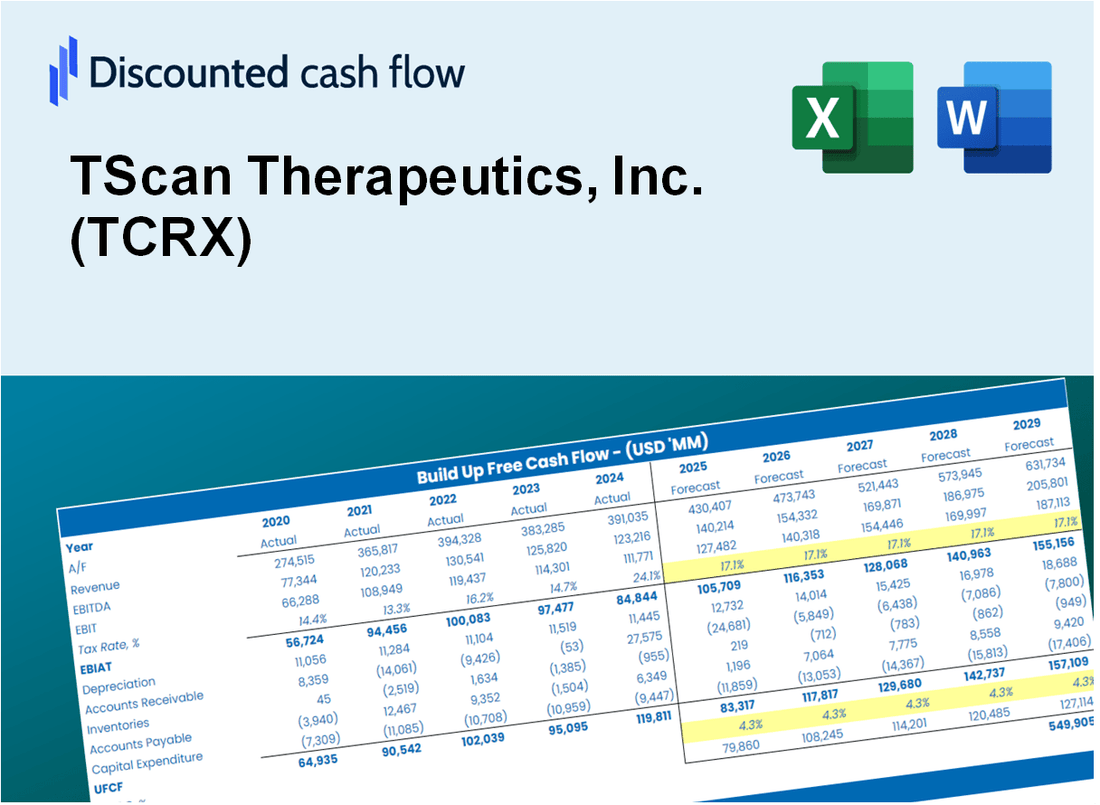
- Preloaded TCRX Data: Historical and projected financial data, including revenue, EBIT, and capital expenditures.
- DCF and WACC Models: Professional-grade sheets for calculating intrinsic value and Weighted Average Cost of Capital.
- Editable Inputs: Yellow-highlighted cells for adjusting revenue growth, tax rates, and discount rates.
- Financial Statements: Comprehensive annual and quarterly financials for deeper analysis.
- Key Ratios: Profitability, leverage, and efficiency ratios to evaluate performance.
- Dashboard and Charts: Visual summaries of valuation outcomes and assumptions.
Disclaimer
All information, articles, and product details provided on this website are for general informational and educational purposes only. We do not claim any ownership over, nor do we intend to infringe upon, any trademarks, copyrights, logos, brand names, or other intellectual property mentioned or depicted on this site. Such intellectual property remains the property of its respective owners, and any references here are made solely for identification or informational purposes, without implying any affiliation, endorsement, or partnership.
We make no representations or warranties, express or implied, regarding the accuracy, completeness, or suitability of any content or products presented. Nothing on this website should be construed as legal, tax, investment, financial, medical, or other professional advice. In addition, no part of this site—including articles or product references—constitutes a solicitation, recommendation, endorsement, advertisement, or offer to buy or sell any securities, franchises, or other financial instruments, particularly in jurisdictions where such activity would be unlawful.
All content is of a general nature and may not address the specific circumstances of any individual or entity. It is not a substitute for professional advice or services. Any actions you take based on the information provided here are strictly at your own risk. You accept full responsibility for any decisions or outcomes arising from your use of this website and agree to release us from any liability in connection with your use of, or reliance upon, the content or products found herein.