
|
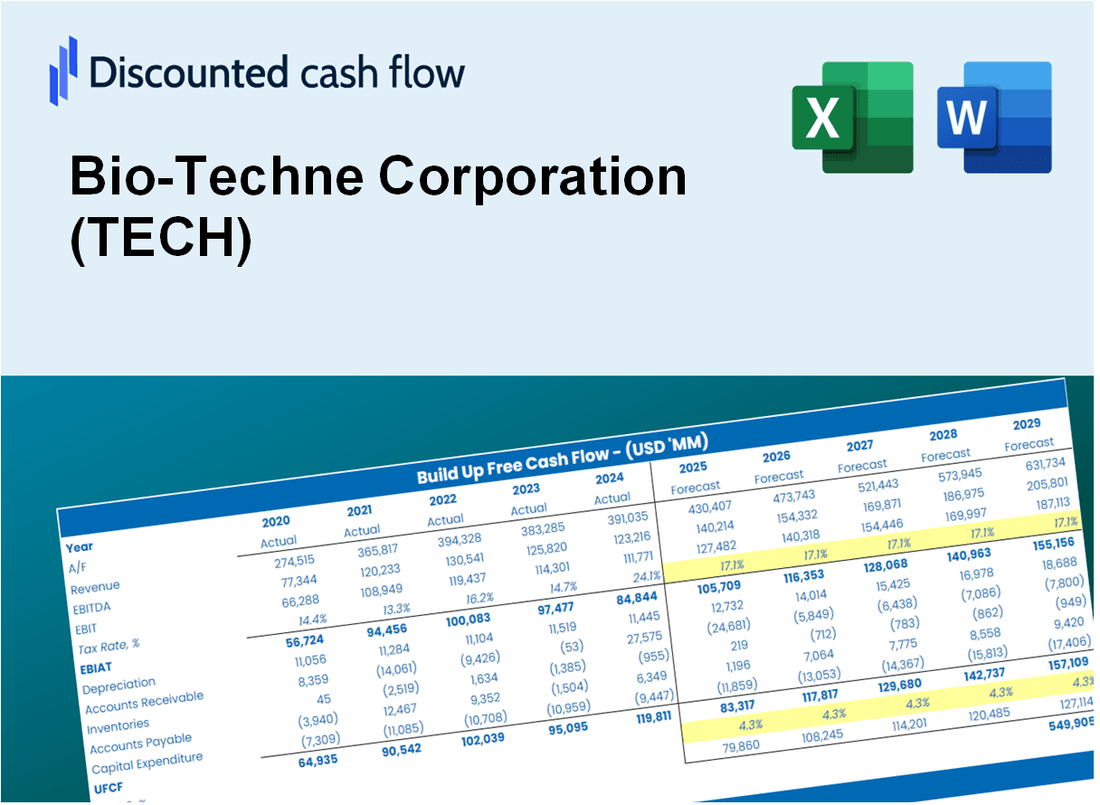
Bio-Techne Corporation (Tech) DCF-Bewertung |
Fully Editable: Tailor To Your Needs In Excel Or Sheets
Professional Design: Trusted, Industry-Standard Templates
Investor-Approved Valuation Models
MAC/PC Compatible, Fully Unlocked
No Expertise Is Needed; Easy To Follow
Bio-Techne Corporation (TECH) Bundle
Unabhängig davon, ob Sie ein Investor oder Analyst sind, ist dieser (Tech) DCF-Taschenrechner Ihre Anlaufstelle für eine genaue Bewertung. Mit echten Daten von der Bio-Techne Corporation geladen, können Sie Prognosen anpassen und die Effekte in Echtzeit betrachten.
What You Will Get
- Editable Excel Template: A fully customizable Excel-based DCF Calculator featuring pre-filled real Bio-Techne Corporation (TECH) financials.
- Real-World Data: Historical data and forward-looking estimates (as indicated in the yellow cells).
- Forecast Flexibility: Adjust forecast assumptions such as revenue growth, EBITDA %, and WACC.
- Automatic Calculations: Instantly observe the effects of your inputs on Bio-Techne Corporation’s valuation.
- Professional Tool: Designed for investors, CFOs, consultants, and financial analysts.
- User-Friendly Design: Organized for clarity and ease of use, complete with step-by-step instructions.
Key Features
- Customizable Forecast Inputs: Adjust essential metrics such as revenue growth, EBITDA %, and capital investments.
- Instant DCF Valuation: Quickly computes intrinsic value, NPV, and other key metrics.
- High-Precision Accuracy: Leverages Bio-Techne’s actual financial data for realistic valuation results.
- Effortless Scenario Analysis: Easily evaluate various assumptions and analyze different outcomes.
- Efficiency Booster: Remove the hassle of constructing intricate valuation models from the ground up.
How It Works
- Download: Get the pre-built Excel file containing Bio-Techne Corporation’s (TECH) financial data.
- Customize: Modify forecasts such as revenue growth, EBITDA %, and WACC to fit your analysis.
- Update Automatically: Watch as the intrinsic value and NPV calculations refresh in real-time.
- Test Scenarios: Develop various projections and instantly compare the results.
- Make Decisions: Leverage the valuation findings to inform your investment approach.
Why Choose Bio-Techne Corporation (TECH)?
- Innovative Solutions: Access cutting-edge technologies and products tailored for life sciences.
- Commitment to Quality: High standards in research and development ensure reliable results.
- Extensive Product Range: A diverse portfolio meets various needs across multiple disciplines.
- Expert Support: Dedicated customer service and technical assistance available for all users.
- Recognized Leader: Trusted by researchers and professionals in the scientific community.
Who Should Use This Product?
- Investors: Accurately estimate Bio-Techne Corporation’s (TECH) fair value before making investment decisions.
- CFOs: Leverage a professional-grade DCF model for financial reporting and analysis related to Bio-Techne Corporation (TECH).
- Consultants: Quickly adapt the template for valuation reports tailored to Bio-Techne Corporation (TECH) clients.
- Entrepreneurs: Gain insights into financial modeling practices utilized by leading biotech firms like Bio-Techne Corporation (TECH).
- Educators: Use it as a teaching tool to demonstrate valuation methodologies relevant to Bio-Techne Corporation (TECH).
What the Template Contains
- Operating and Balance Sheet Data: Pre-filled Bio-Techne Corporation (TECH) historical data and forecasts, including revenue, EBITDA, EBIT, and capital expenditures.
- WACC Calculation: A dedicated sheet for Weighted Average Cost of Capital (WACC), including parameters like Beta, risk-free rate, and share price.
- DCF Valuation (Unlevered and Levered): Editable Discounted Cash Flow models showing intrinsic value with detailed calculations.
- Financial Statements: Pre-loaded financial statements (annual and quarterly) to support analysis.
- Key Ratios: Includes profitability, leverage, and efficiency ratios for Bio-Techne Corporation (TECH).
- Dashboard and Charts: Visual summary of valuation outputs and assumptions to analyze results easily.
Disclaimer
All information, articles, and product details provided on this website are for general informational and educational purposes only. We do not claim any ownership over, nor do we intend to infringe upon, any trademarks, copyrights, logos, brand names, or other intellectual property mentioned or depicted on this site. Such intellectual property remains the property of its respective owners, and any references here are made solely for identification or informational purposes, without implying any affiliation, endorsement, or partnership.
We make no representations or warranties, express or implied, regarding the accuracy, completeness, or suitability of any content or products presented. Nothing on this website should be construed as legal, tax, investment, financial, medical, or other professional advice. In addition, no part of this site—including articles or product references—constitutes a solicitation, recommendation, endorsement, advertisement, or offer to buy or sell any securities, franchises, or other financial instruments, particularly in jurisdictions where such activity would be unlawful.
All content is of a general nature and may not address the specific circumstances of any individual or entity. It is not a substitute for professional advice or services. Any actions you take based on the information provided here are strictly at your own risk. You accept full responsibility for any decisions or outcomes arising from your use of this website and agree to release us from any liability in connection with your use of, or reliance upon, the content or products found herein.