
|
Teleperformance SE (TEP.PA) DCF -Bewertung |
Fully Editable: Tailor To Your Needs In Excel Or Sheets
Professional Design: Trusted, Industry-Standard Templates
Investor-Approved Valuation Models
MAC/PC Compatible, Fully Unlocked
No Expertise Is Needed; Easy To Follow
Teleperformance SE (TEP.PA) Bundle
Entdecken Sie den tatsächlichen Wert der Teleperformance SE (TEPPA) mit unserem DCF-Taschenrechner in professionellem Qualitäts! Passen Sie die wichtigsten Annahmen an, erkunden Sie verschiedene Szenarien und bewerten Sie, wie Änderungen die Bewertung der Teleperformance SE (TEPPA) beeinflussen - alles innerhalb einer einzelnen Excel -Vorlage.
What You Will Receive
- Pre-Filled Financial Model: Utilizing Teleperformance's actual data for accurate DCF valuation.
- Comprehensive Forecast Control: Modify revenue growth, profit margins, WACC, and other essential variables.
- Instant Calculations: Automatic updates provide real-time results as adjustments are made.
- Investor-Ready Template: A polished Excel file crafted for high-quality valuation.
- Customizable and Reusable: Designed for adaptability, enabling repeated application for intricate forecasts.
Key Features
- Customizable Forecast Inputs: Adjust essential variables such as revenue growth, EBITDA margin, and capital investments.
- Instant DCF Valuation: Automatically computes intrinsic value, NPV, and additional outputs with ease.
- High-Precision Accuracy: Leverages Teleperformance SE’s real financial data to ensure realistic valuation results.
- Simplified Scenario Analysis: Easily test various assumptions and analyze different outcomes side by side.
- Efficiency Booster: Remove the hassle of constructing intricate valuation models from the ground up.
How It Works
- Step 1: Download the prebuilt Excel template featuring Teleperformance SE's (TEPPA) data.
- Step 2: Navigate through the filled sheets to grasp the essential metrics.
- Step 3: Modify the forecasts and assumptions in the editable yellow cells (WACC, growth, margins).
- Step 4: View the updated results immediately, including the intrinsic value of Teleperformance SE (TEPPA).
- Step 5: Make well-informed investment choices or generate reports based on the outputs.
Why Opt for This Calculator?
- Designed for Experts: A sophisticated tool utilized by analysts, CFOs, and consultants.
- Accurate Data: Teleperformance SE’s (TEPPA) historical and projected financials preloaded for precision.
- Flexible Scenario Analysis: Effortlessly test various forecasts and assumptions.
- Comprehensive Outputs: Automatically determines intrinsic value, NPV, and other essential metrics.
- User-Friendly: Step-by-step guidance helps you navigate the process with ease.
Who Can Benefit from This Product?
- Finance Students: Master valuation techniques and apply them to real-world data.
- Academics: Integrate professional models into your teaching or research efforts.
- Investors: Validate your hypotheses and analyze valuation results for Teleperformance SE (TEPPA).
- Analysts: Enhance your efficiency with a ready-to-use, customizable DCF model.
- Small Business Owners: Discover how large publicly traded companies like Teleperformance SE (TEPPA) are evaluated.
Contents of the Template
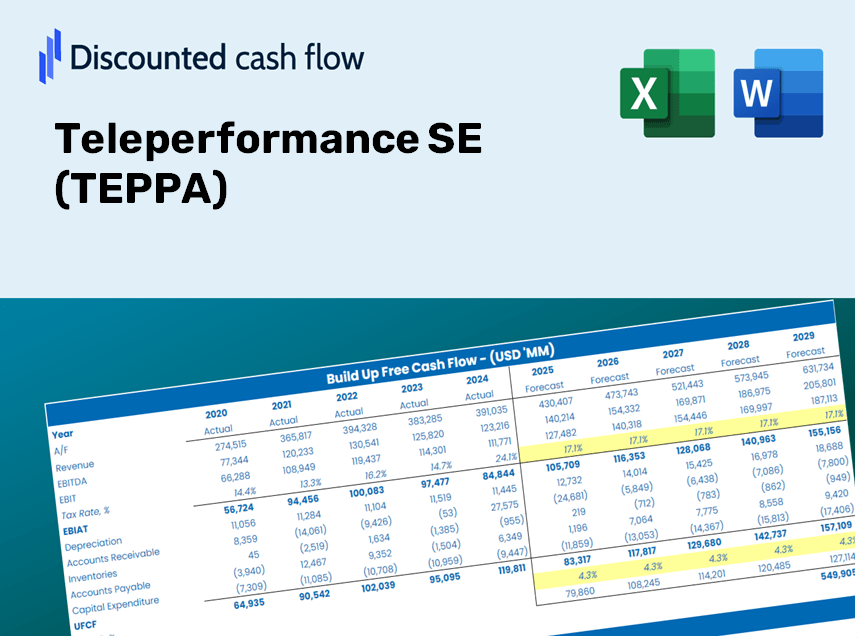
- Operating and Balance Sheet Data: Pre-filled historical data and forecasts for Teleperformance SE (TEPPA), including metrics such as revenue, EBITDA, EBIT, and capital expenditures.
- WACC Calculation: A specific sheet for the Weighted Average Cost of Capital (WACC), featuring key parameters like Beta, risk-free rate, and share price.
- DCF Valuation (Unlevered and Levered): Customizable Discounted Cash Flow models demonstrating intrinsic value with comprehensive calculations.
- Financial Statements: Pre-loaded annual and quarterly financial statements to facilitate analysis.
- Key Ratios: Includes profitability, leverage, and efficiency ratios specific to Teleperformance SE (TEPPA).
- Dashboard and Charts: Visual representation of valuation outputs and underlying assumptions for easy result analysis.
Disclaimer
All information, articles, and product details provided on this website are for general informational and educational purposes only. We do not claim any ownership over, nor do we intend to infringe upon, any trademarks, copyrights, logos, brand names, or other intellectual property mentioned or depicted on this site. Such intellectual property remains the property of its respective owners, and any references here are made solely for identification or informational purposes, without implying any affiliation, endorsement, or partnership.
We make no representations or warranties, express or implied, regarding the accuracy, completeness, or suitability of any content or products presented. Nothing on this website should be construed as legal, tax, investment, financial, medical, or other professional advice. In addition, no part of this site—including articles or product references—constitutes a solicitation, recommendation, endorsement, advertisement, or offer to buy or sell any securities, franchises, or other financial instruments, particularly in jurisdictions where such activity would be unlawful.
All content is of a general nature and may not address the specific circumstances of any individual or entity. It is not a substitute for professional advice or services. Any actions you take based on the information provided here are strictly at your own risk. You accept full responsibility for any decisions or outcomes arising from your use of this website and agree to release us from any liability in connection with your use of, or reliance upon, the content or products found herein.