
|
TFI International Inc. (TFII) DCF -Bewertung |
Fully Editable: Tailor To Your Needs In Excel Or Sheets
Professional Design: Trusted, Industry-Standard Templates
Investor-Approved Valuation Models
MAC/PC Compatible, Fully Unlocked
No Expertise Is Needed; Easy To Follow
TFI International Inc. (TFII) Bundle
Möchten Sie den inneren Wert von TFI International Inc. bewerten? Unser TFII DCF-Taschenrechner integriert reale Daten mit umfangreichen Anpassungsfunktionen, sodass Sie Ihre Prognosen verfeinern und Ihre Investitionsauswahl verbessern können.
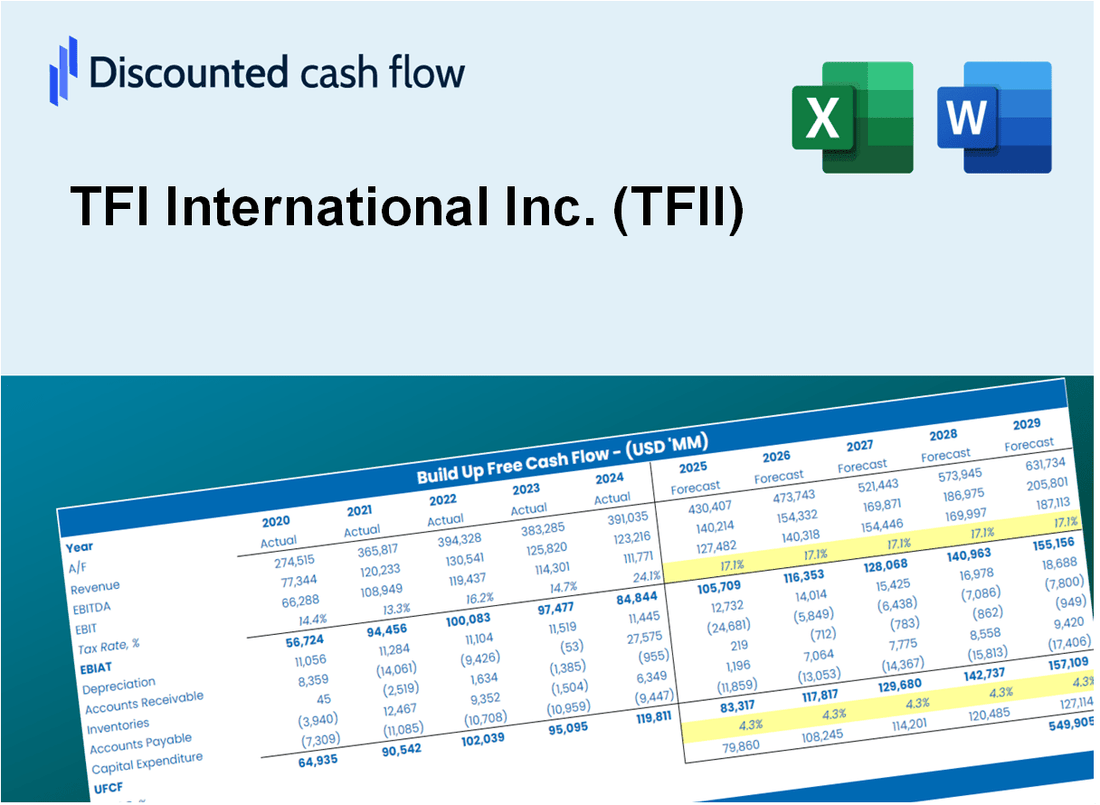
Discounted Cash Flow (DCF) - (USD MM)
| Year | AY1 2020 |
AY2 2021 |
AY3 2022 |
AY4 2023 |
AY5 2024 |
FY1 2025 |
FY2 2026 |
FY3 2027 |
FY4 2028 |
FY5 2029 |
|---|---|---|---|---|---|---|---|---|---|---|
| Revenue | 2,713.0 | 5,180.8 | 6,323.1 | 5,396.5 | 6,024.8 | 7,681.7 | 9,794.1 | 12,487.4 | 15,921.4 | 20,299.7 |
| Revenue Growth, % | 0 | 90.96 | 22.05 | -14.65 | 11.64 | 27.5 | 27.5 | 27.5 | 27.5 | 27.5 |
| EBITDA | 508.9 | 974.9 | 1,120.6 | 856.9 | 929.0 | 1,330.4 | 1,696.3 | 2,162.7 | 2,757.4 | 3,515.7 |
| EBITDA, % | 18.76 | 18.82 | 17.72 | 15.88 | 15.42 | 17.32 | 17.32 | 17.32 | 17.32 | 17.32 |
| Depreciation | 214.7 | 282.0 | 309.0 | 317.1 | 417.6 | 477.1 | 608.2 | 775.5 | 988.8 | 1,260.7 |
| Depreciation, % | 7.91 | 5.44 | 4.89 | 5.88 | 6.93 | 6.21 | 6.21 | 6.21 | 6.21 | 6.21 |
| EBIT | 294.2 | 692.9 | 811.6 | 539.7 | 511.4 | 853.3 | 1,088.0 | 1,387.2 | 1,768.7 | 2,255.1 |
| EBIT, % | 10.85 | 13.37 | 12.84 | 10 | 8.49 | 11.11 | 11.11 | 11.11 | 11.11 | 11.11 |
| Total Cash | 3.1 | 13.8 | 105.6 | 240.8 | .0 | 100.0 | 127.6 | 162.6 | 207.4 | 264.4 |
| Total Cash, percent | .0 | .0 | .0 | .0 | .0 | .0 | .0 | .0 | .0 | .0 |
| Account Receivables | 434.4 | 762.1 | 748.7 | 659.0 | 674.2 | 1,013.5 | 1,292.1 | 1,647.5 | 2,100.5 | 2,678.2 |
| Account Receivables, % | 16.01 | 14.71 | 11.84 | 12.21 | 11.19 | 13.19 | 13.19 | 13.19 | 13.19 | 13.19 |
| Inventories | 6.3 | 17.5 | 17.4 | 17.2 | 12.9 | 21.1 | 27.0 | 34.4 | 43.8 | 55.9 |
| Inventories, % | 0.2317 | 0.33796 | 0.27439 | 0.31862 | 0.21391 | 0.27532 | 0.27532 | 0.27532 | 0.27532 | 0.27532 |
| Accounts Payable | 235.1 | 439.2 | 357.9 | 323.3 | 309.0 | 521.1 | 664.5 | 847.2 | 1,080.1 | 1,377.2 |
| Accounts Payable, % | 8.66 | 8.48 | 5.66 | 5.99 | 5.13 | 6.78 | 6.78 | 6.78 | 6.78 | 6.78 |
| Capital Expenditure | -103.6 | -197.9 | -256.1 | -261.4 | -286.4 | -327.0 | -416.9 | -531.6 | -677.8 | -864.2 |
| Capital Expenditure, % | -3.82 | -3.82 | -4.05 | -4.84 | -4.75 | -4.26 | -4.26 | -4.26 | -4.26 | -4.26 |
| Tax Rate, % | 24.65 | 24.65 | 24.65 | 24.65 | 24.65 | 24.65 | 24.65 | 24.65 | 24.65 | 24.65 |
| EBITAT | 223.7 | 640.5 | 627.0 | 402.7 | 385.3 | 675.2 | 860.9 | 1,097.7 | 1,399.5 | 1,784.4 |
| Depreciation | ||||||||||
| Changes in Account Receivables | ||||||||||
| Changes in Inventories | ||||||||||
| Changes in Accounts Payable | ||||||||||
| Capital Expenditure | ||||||||||
| UFCF | 129.1 | 589.8 | 612.0 | 513.8 | 491.3 | 690.0 | 911.0 | 1,161.6 | 1,481.0 | 1,888.3 |
| WACC, % | 8.42 | 8.61 | 8.43 | 8.4 | 8.41 | 8.46 | 8.46 | 8.46 | 8.46 | 8.46 |
| PV UFCF | ||||||||||
| SUM PV UFCF | 4,650.0 | |||||||||
| Long Term Growth Rate, % | 2.00 | |||||||||
| Free cash flow (T + 1) | 1,926 | |||||||||
| Terminal Value | 29,834 | |||||||||
| Present Terminal Value | 19,881 | |||||||||
| Enterprise Value | 24,531 | |||||||||
| Net Debt | 2,141 | |||||||||
| Equity Value | 22,391 | |||||||||
| Diluted Shares Outstanding, MM | 85 | |||||||||
| Equity Value Per Share | 262.67 |
What You Will Get
- Real TFII Financial Data: Pre-filled with TFI International’s historical and projected data for precise analysis.
- Fully Editable Template: Modify key inputs like revenue growth, WACC, and EBITDA % with ease.
- Automatic Calculations: See TFI International’s intrinsic value update instantly based on your changes.
- Professional Valuation Tool: Designed for investors, analysts, and consultants seeking accurate DCF results.
- User-Friendly Design: Simple structure and clear instructions for all experience levels.
Key Features
- Comprehensive DCF Calculator: Features detailed unlevered and levered DCF valuation models tailored for TFI International Inc. (TFII).
- WACC Calculator: Pre-structured Weighted Average Cost of Capital sheet with adjustable inputs specific to TFI International Inc. (TFII).
- Customizable Forecast Assumptions: Adjust growth rates, capital expenditures, and discount rates to fit TFI International Inc. (TFII).
- Integrated Financial Ratios: Evaluate profitability, leverage, and efficiency ratios pertinent to TFI International Inc. (TFII).
- Interactive Dashboard and Charts: Visual outputs present key valuation metrics for TFI International Inc. (TFII) for straightforward analysis.
How It Works
- Download: Access the ready-to-use Excel file with TFI International Inc.'s (TFII) financial data.
- Customize: Adjust forecasts, including revenue growth, EBITDA %, and WACC.
- Update Automatically: The intrinsic value and NPV calculations update in real-time.
- Test Scenarios: Create multiple projections and compare outcomes instantly.
- Make Decisions: Use the valuation results to guide your investment strategy.
Why Choose TFI International Inc. (TFII)?
- Streamlined Operations: Benefit from a well-established logistics network that enhances efficiency.
- Robust Financial Performance: Consistent revenue growth backed by reliable financial strategies.
- Custom Solutions: Flexible services designed to meet diverse transportation and logistics needs.
- Data-Driven Insights: Utilize advanced analytics for informed decision-making and operational improvements.
- Industry Expertise: A trusted partner in logistics, recognized for excellence and innovation.
Who Should Use This Product?
- Finance Students: Master valuation techniques and apply them to real-world data for TFI International Inc. (TFII).
- Academics: Enhance your coursework or research by integrating professional models related to TFI International Inc. (TFII).
- Investors: Validate your investment assumptions and evaluate valuation outcomes for TFI International Inc. (TFII).
- Analysts: Optimize your analysis process with a customizable DCF model tailored for TFI International Inc. (TFII).
- Small Business Owners: Discover how large public companies like TFI International Inc. (TFII) are evaluated in the market.
What the Template Contains
- Preloaded TFII Data: Historical and projected financial data, including revenue, EBIT, and capital expenditures.
- DCF and WACC Models: Professional-grade sheets for calculating intrinsic value and Weighted Average Cost of Capital.
- Editable Inputs: Yellow-highlighted cells for adjusting revenue growth, tax rates, and discount rates.
- Financial Statements: Comprehensive annual and quarterly financials for deeper analysis.
- Key Ratios: Profitability, leverage, and efficiency ratios to evaluate performance.
- Dashboard and Charts: Visual summaries of valuation outcomes and assumptions.
Disclaimer
All information, articles, and product details provided on this website are for general informational and educational purposes only. We do not claim any ownership over, nor do we intend to infringe upon, any trademarks, copyrights, logos, brand names, or other intellectual property mentioned or depicted on this site. Such intellectual property remains the property of its respective owners, and any references here are made solely for identification or informational purposes, without implying any affiliation, endorsement, or partnership.
We make no representations or warranties, express or implied, regarding the accuracy, completeness, or suitability of any content or products presented. Nothing on this website should be construed as legal, tax, investment, financial, medical, or other professional advice. In addition, no part of this site—including articles or product references—constitutes a solicitation, recommendation, endorsement, advertisement, or offer to buy or sell any securities, franchises, or other financial instruments, particularly in jurisdictions where such activity would be unlawful.
All content is of a general nature and may not address the specific circumstances of any individual or entity. It is not a substitute for professional advice or services. Any actions you take based on the information provided here are strictly at your own risk. You accept full responsibility for any decisions or outcomes arising from your use of this website and agree to release us from any liability in connection with your use of, or reliance upon, the content or products found herein.