
|
Tikehau Capital (TKO.PA) DCF -Bewertung |
Fully Editable: Tailor To Your Needs In Excel Or Sheets
Professional Design: Trusted, Industry-Standard Templates
Investor-Approved Valuation Models
MAC/PC Compatible, Fully Unlocked
No Expertise Is Needed; Easy To Follow
Tikehau Capital (TKO.PA) Bundle
Verbessern Sie Ihre Anlagestrategien mit dem Tikehau Capital (TKOPA) DCF -Taschenrechner! Erforschen Sie authentische Tikehau -Finanzdaten, passen Sie Wachstumsprojektionen und -kosten an und beachten Sie sofort, wie sich diese Veränderungen auf den inneren Wert des Tikehau -Kapitals (TKOPA) auswirken.
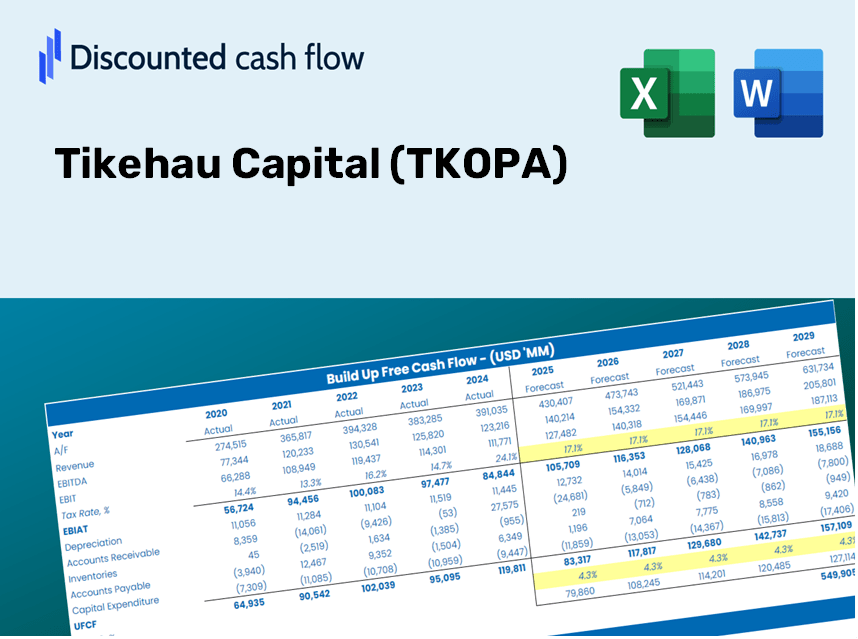
Discounted Cash Flow (DCF) - (USD MM)
| Year | AY1 2020 |
AY2 2021 |
AY3 2022 |
AY4 2023 |
AY5 2024 |
FY1 2025 |
FY2 2026 |
FY3 2027 |
FY4 2028 |
FY5 2029 |
|---|---|---|---|---|---|---|---|---|---|---|
| Revenue | 15.6 | 567.7 | 602.4 | 620.3 | 557.8 | 695.9 | 868.1 | 1,083.0 | 1,351.1 | 1,685.5 |
| Revenue Growth, % | 0 | 3549.1 | 6.11 | 2.97 | -10.07 | 24.75 | 24.75 | 24.75 | 24.75 | 24.75 |
| EBITDA | -223.7 | 407.0 | 378.2 | 241.5 | .0 | 102.2 | 127.5 | 159.0 | 198.4 | 247.5 |
| EBITDA, % | -1437.72 | 71.7 | 62.78 | 38.93 | 0 | 14.68 | 14.68 | 14.68 | 14.68 | 14.68 |
| Depreciation | -44.7 | 3.0 | 6.6 | 9.5 | -270.4 | -202.2 | -252.3 | -314.7 | -392.6 | -489.8 |
| Depreciation, % | -287.45 | 0.53674 | 1.09 | 1.53 | -48.48 | -29.06 | -29.06 | -29.06 | -29.06 | -29.06 |
| EBIT | -178.9 | 404.0 | 371.6 | 232.0 | 270.4 | 165.2 | 206.1 | 257.2 | 320.8 | 400.2 |
| EBIT, % | -1150.27 | 71.17 | 61.69 | 37.4 | 48.48 | 23.75 | 23.75 | 23.75 | 23.75 | 23.75 |
| Total Cash | 958.0 | 1,272.7 | 631.4 | 322.6 | 337.0 | 574.0 | 716.1 | 893.3 | 1,114.4 | 1,390.2 |
| Total Cash, percent | .0 | .0 | .0 | .0 | .0 | .0 | .0 | .0 | .0 | .0 |
| Account Receivables | 65.2 | 98.6 | 101.1 | 100.8 | 163.5 | 250.1 | 312.0 | 389.3 | 485.6 | 605.8 |
| Account Receivables, % | 418.99 | 17.37 | 16.78 | 16.26 | 29.32 | 35.94 | 35.94 | 35.94 | 35.94 | 35.94 |
| Inventories | .0 | .0 | .0 | .0 | .0 | .0 | .0 | .0 | .0 | .0 |
| Inventories, % | 0 | 0 | 0 | 0 | 0 | 0 | 0 | 0 | 0 | 0 |
| Accounts Payable | 46.6 | 35.5 | 35.1 | 26.0 | 34.8 | 170.5 | 212.7 | 265.4 | 331.1 | 413.0 |
| Accounts Payable, % | 299.23 | 6.25 | 5.83 | 4.2 | 6.24 | 24.5 | 24.5 | 24.5 | 24.5 | 24.5 |
| Capital Expenditure | .0 | .0 | .0 | .0 | .0 | .0 | .0 | .0 | .0 | .0 |
| Capital Expenditure, % | 0 | 0 | 0 | 0 | 0 | 0 | 0 | 0 | 0 | 0 |
| Tax Rate, % | 25.54 | 25.54 | 25.54 | 25.54 | 25.54 | 25.54 | 25.54 | 25.54 | 25.54 | 25.54 |
| EBITAT | -140.2 | 346.4 | 320.0 | 214.0 | 201.3 | 137.8 | 171.9 | 214.4 | 267.5 | 333.7 |
| Depreciation | ||||||||||
| Changes in Account Receivables | ||||||||||
| Changes in Inventories | ||||||||||
| Changes in Accounts Payable | ||||||||||
| Capital Expenditure | ||||||||||
| UFCF | -203.6 | 305.0 | 323.7 | 214.7 | -123.0 | -15.4 | -100.1 | -124.9 | -155.8 | -194.4 |
| WACC, % | 5.33 | 5.45 | 5.46 | 5.56 | 5.27 | 5.41 | 5.41 | 5.41 | 5.41 | 5.41 |
| PV UFCF | ||||||||||
| SUM PV UFCF | -486.8 | |||||||||
| Long Term Growth Rate, % | 2.00 | |||||||||
| Free cash flow (T + 1) | -198 | |||||||||
| Terminal Value | -5,811 | |||||||||
| Present Terminal Value | -4,465 | |||||||||
| Enterprise Value | -4,952 | |||||||||
| Net Debt | 1,304 | |||||||||
| Equity Value | -6,256 | |||||||||
| Diluted Shares Outstanding, MM | 180 | |||||||||
| Equity Value Per Share | -34.67 |
What You Will Gain
- Authentic TKOPA Financial Data: Access historical and projected figures for precise valuation.
- Customizable Inputs: Adjust WACC, tax rates, revenue growth, and capital investments to suit your analysis.
- Automatic Calculations: Intrinsic value and NPV are computed in real-time.
- Scenario Analysis: Explore various scenarios to assess Tikehau Capital’s future performance.
- User-Friendly Design: Crafted for professionals while remaining approachable for newcomers.
Key Features
- Actual Tikehau Capital Data: Pre-loaded with Tikehau's historical financial performance and future growth estimations.
- Fully Customizable Parameters: Modify revenue growth rates, profit margins, WACC, tax rates, and capital investments to fit your analysis.
- Responsive Valuation Model: Automatic recalculations of Net Present Value (NPV) and intrinsic value based on your adjustments.
- Scenario Analysis: Generate various projection scenarios to examine different valuation results.
- User-Centric Interface: Intuitive, organized, and suitable for both experienced professionals and newcomers.
How It Works
- Step 1: Download the Excel file.
- Step 2: Review the pre-filled Tikehau Capital (TKOPA) data (historical and projected).
- Step 3: Modify key assumptions (highlighted in yellow) based on your analysis.
- Step 4: Observe automatic recalculations for Tikehau Capital's intrinsic value.
- Step 5: Utilize the results for investment decisions or reporting.
Why Choose This Calculator for Tikehau Capital (TKOPA)?
- User-Friendly Interface: Tailored for both novice and experienced users.
- Customizable Inputs: Easily adjust parameters to suit your financial analysis.
- Real-Time Adjustments: Witness immediate updates to Tikehau Capital’s valuation as you change inputs.
- Pre-Loaded Data: Comes equipped with Tikehau Capital's actual financial information for swift evaluations.
- Relied Upon by Experts: Favored by investors and analysts for making well-informed choices.
Who Should Use Tikehau Capital (TKOPA)?
- Investors: Evaluate Tikehau Capital’s valuation to make informed decisions on stock transactions.
- CFOs and Financial Analysts: Optimize valuation workflows and validate financial projections.
- Startup Founders: Gain insights into the valuation methods of established firms like Tikehau Capital.
- Consultants: Provide thorough valuation analyses and reports to clients.
- Students and Educators: Utilize current market data to practice and teach valuation methodologies.
Contents of the Template
- Pre-Filled DCF Model: Tikehau Capital’s financial data preloaded for immediate application.
- WACC Calculator: Comprehensive calculations for Weighted Average Cost of Capital.
- Financial Ratios: Assess Tikehau Capital’s profitability, leverage, and operational efficiency.
- Editable Inputs: Modify assumptions such as growth rates, profit margins, and CAPEX to tailor your analysis.
- Financial Statements: Access annual and quarterly reports to facilitate in-depth evaluations.
- Interactive Dashboard: Effortlessly visualize essential valuation metrics and outcomes.
Disclaimer
All information, articles, and product details provided on this website are for general informational and educational purposes only. We do not claim any ownership over, nor do we intend to infringe upon, any trademarks, copyrights, logos, brand names, or other intellectual property mentioned or depicted on this site. Such intellectual property remains the property of its respective owners, and any references here are made solely for identification or informational purposes, without implying any affiliation, endorsement, or partnership.
We make no representations or warranties, express or implied, regarding the accuracy, completeness, or suitability of any content or products presented. Nothing on this website should be construed as legal, tax, investment, financial, medical, or other professional advice. In addition, no part of this site—including articles or product references—constitutes a solicitation, recommendation, endorsement, advertisement, or offer to buy or sell any securities, franchises, or other financial instruments, particularly in jurisdictions where such activity would be unlawful.
All content is of a general nature and may not address the specific circumstances of any individual or entity. It is not a substitute for professional advice or services. Any actions you take based on the information provided here are strictly at your own risk. You accept full responsibility for any decisions or outcomes arising from your use of this website and agree to release us from any liability in connection with your use of, or reliance upon, the content or products found herein.