
|
LendingTree, Inc. (Baum) DCF -Bewertung |
Fully Editable: Tailor To Your Needs In Excel Or Sheets
Professional Design: Trusted, Industry-Standard Templates
Investor-Approved Valuation Models
MAC/PC Compatible, Fully Unlocked
No Expertise Is Needed; Easy To Follow
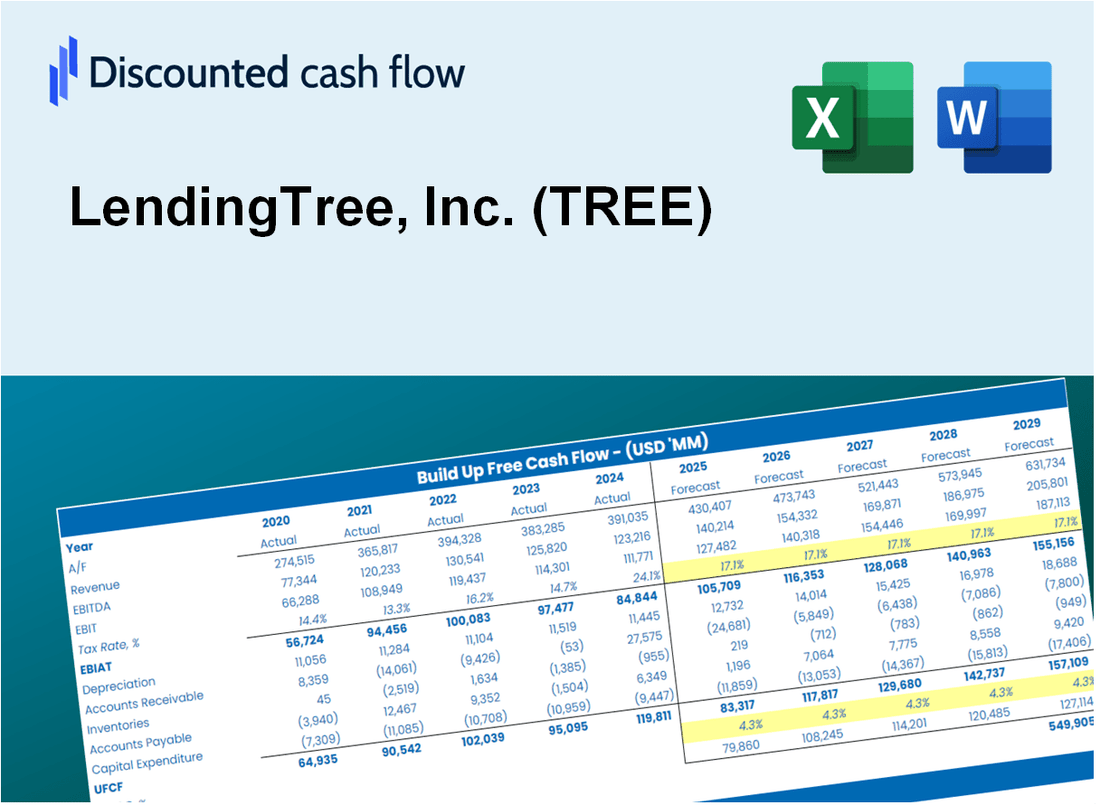
LendingTree, Inc. (TREE) Bundle
Bewerten Sie die finanzielle Aussichten von LendingTree, Inc. (Tree) mit Experten -Präzision! Dieser (Baum-) DCF-Taschenrechner verfügt über vorgefüllte Finanzdaten und bietet vollständige Flexibilität, um das Umsatzwachstum, WACC, Margen und andere wichtige Annahmen zu ändern, um sich an Ihren Projektionen auszurichten.
Discounted Cash Flow (DCF) - (USD MM)
| Year | AY1 2020 |
AY2 2021 |
AY3 2022 |
AY4 2023 |
AY5 2024 |
FY1 2025 |
FY2 2026 |
FY3 2027 |
FY4 2028 |
FY5 2029 |
|---|---|---|---|---|---|---|---|---|---|---|
| Revenue | 910.0 | 1,098.5 | 985.0 | 672.5 | 900.2 | 928.4 | 957.4 | 987.4 | 1,018.3 | 1,050.2 |
| Revenue Growth, % | 0 | 20.72 | -10.33 | -31.73 | 33.86 | 3.13 | 3.13 | 3.13 | 3.13 | 3.13 |
| EBITDA | 61.1 | 47.6 | 16.5 | 21.9 | 73.1 | 44.7 | 46.1 | 47.6 | 49.1 | 50.6 |
| EBITDA, % | 6.71 | 4.33 | 1.67 | 3.25 | 8.12 | 4.82 | 4.82 | 4.82 | 4.82 | 4.82 |
| Depreciation | 67.3 | 60.6 | 45.4 | 26.8 | 24.2 | 44.9 | 46.3 | 47.8 | 49.3 | 50.8 |
| Depreciation, % | 7.39 | 5.52 | 4.61 | 3.98 | 2.69 | 4.84 | 4.84 | 4.84 | 4.84 | 4.84 |
| EBIT | -6.2 | -13.1 | -28.9 | -4.9 | 48.9 | -.2 | -.2 | -.2 | -.2 | -.2 |
| EBIT, % | -0.68429 | -1.19 | -2.94 | -0.72937 | 5.44 | -0.02070502 | -0.02070502 | -0.02070502 | -0.02070502 | -0.02070502 |
| Total Cash | 169.9 | 251.2 | 298.8 | 112.1 | 106.6 | 186.4 | 192.2 | 198.2 | 204.5 | 210.8 |
| Total Cash, percent | .0 | .0 | .0 | .0 | .0 | .0 | .0 | .0 | .0 | .0 |
| Account Receivables | 89.8 | 97.7 | 83.1 | 55.0 | 118.3 | 90.1 | 92.9 | 95.8 | 98.8 | 101.9 |
| Account Receivables, % | 9.87 | 8.89 | 8.43 | 8.17 | 13.14 | 9.7 | 9.7 | 9.7 | 9.7 | 9.7 |
| Inventories | .0 | .1 | .0 | .0 | .0 | .0 | .0 | .0 | .0 | .0 |
| Inventories, % | 0 | 0.0101047 | 0 | 0.000743492213 | 0 | 0.00216964 | 0.00216964 | 0.00216964 | 0.00216964 | 0.00216964 |
| Accounts Payable | 10.1 | 1.7 | 2.0 | 2.0 | 8.4 | 5.0 | 5.2 | 5.3 | 5.5 | 5.7 |
| Accounts Payable, % | 1.11 | 0.15403 | 0.20609 | 0.29145 | 0.92866 | 0.53827 | 0.53827 | 0.53827 | 0.53827 | 0.53827 |
| Capital Expenditure | -42.1 | -35.1 | -11.4 | -12.5 | -11.2 | -22.5 | -23.2 | -23.9 | -24.6 | -25.4 |
| Capital Expenditure, % | -4.63 | -3.19 | -1.16 | -1.86 | -1.25 | -2.42 | -2.42 | -2.42 | -2.42 | -2.42 |
| Tax Rate, % | -11.56 | -11.56 | -11.56 | -11.56 | -11.56 | -11.56 | -11.56 | -11.56 | -11.56 | -11.56 |
| EBITAT | -7.1 | -10.7 | -98.9 | -4.8 | 54.6 | -.2 | -.2 | -.2 | -.2 | -.2 |
| Depreciation | ||||||||||
| Changes in Account Receivables | ||||||||||
| Changes in Inventories | ||||||||||
| Changes in Accounts Payable | ||||||||||
| Capital Expenditure | ||||||||||
| UFCF | -61.7 | -1.5 | -49.9 | 37.5 | 10.6 | 47.1 | 20.3 | 20.9 | 21.6 | 22.3 |
| WACC, % | 9.74 | 9.32 | 9.74 | 9.69 | 9.74 | 9.65 | 9.65 | 9.65 | 9.65 | 9.65 |
| PV UFCF | ||||||||||
| SUM PV UFCF | 104.7 | |||||||||
| Long Term Growth Rate, % | 2.00 | |||||||||
| Free cash flow (T + 1) | 23 | |||||||||
| Terminal Value | 297 | |||||||||
| Present Terminal Value | 187 | |||||||||
| Enterprise Value | 292 | |||||||||
| Net Debt | 437 | |||||||||
| Equity Value | -145 | |||||||||
| Diluted Shares Outstanding, MM | 13 | |||||||||
| Equity Value Per Share | -10.95 |
What You Will Get
- Real LendingTree Data: Preloaded financials – from revenue to EBIT – based on actual and projected figures.
- Full Customization: Adjust all critical parameters (yellow cells) like WACC, growth %, and tax rates.
- Instant Valuation Updates: Automatic recalculations to analyze the impact of changes on LendingTree’s fair value.
- Versatile Excel Template: Tailored for quick edits, scenario testing, and detailed projections.
- Time-Saving and Accurate: Skip building models from scratch while maintaining precision and flexibility.
Key Features
- Comprehensive Loan Comparison Tool: Effortlessly compare various loan options from multiple lenders.
- Personalized Rate Alerts: Set up alerts to receive notifications on changes in interest rates tailored to your needs.
- Customizable Financial Calculators: Access tools for mortgage, auto loan, and personal loan calculations with adjustable parameters.
- In-Depth Market Insights: Gain access to valuable data and trends regarding lending practices and interest rates.
- User-Friendly Dashboard: A streamlined interface that presents essential metrics and loan options for quick decision-making.
How It Works
- Step 1: Download the Excel file.
- Step 2: Review pre-entered LendingTree, Inc. (TREE) data (historical and projected).
- Step 3: Adjust key assumptions (yellow cells) based on your analysis.
- Step 4: View automatic recalculations for LendingTree, Inc. (TREE)’s intrinsic value.
- Step 5: Use the outputs for investment decisions or reporting.
Why Choose LendingTree's Calculator?
- Accuracy: Utilizes real LendingTree financial data for precise calculations.
- Flexibility: Allows users to easily adjust and experiment with various inputs.
- Time-Saving: Avoid the complexity of creating a financial model from the ground up.
- Professional-Grade: Crafted with the expertise and attention to detail expected at the CFO level.
- User-Friendly: Intuitive interface designed for users of all financial backgrounds.
Who Should Use This Product?
- Investors: Evaluate LendingTree's valuation before making investment decisions.
- CFOs and Financial Analysts: Optimize valuation methodologies and assess financial forecasts.
- Startup Founders: Understand the valuation strategies of established companies like LendingTree.
- Consultants: Provide detailed valuation analyses and reports for clients.
- Students and Educators: Utilize current market data to learn and teach valuation principles.
What the Template Contains
- Operating and Balance Sheet Data: Pre-filled LendingTree historical data and forecasts, including revenue, EBITDA, EBIT, and capital expenditures.
- WACC Calculation: A dedicated sheet for Weighted Average Cost of Capital (WACC), including parameters like Beta, risk-free rate, and share price.
- DCF Valuation (Unlevered and Levered): Editable Discounted Cash Flow models showing intrinsic value with detailed calculations.
- Financial Statements: Pre-loaded financial statements (annual and quarterly) to support analysis.
- Key Ratios: Includes profitability, leverage, and efficiency ratios for LendingTree, Inc. (TREE).
- Dashboard and Charts: Visual summary of valuation outputs and assumptions to analyze results easily.
Disclaimer
All information, articles, and product details provided on this website are for general informational and educational purposes only. We do not claim any ownership over, nor do we intend to infringe upon, any trademarks, copyrights, logos, brand names, or other intellectual property mentioned or depicted on this site. Such intellectual property remains the property of its respective owners, and any references here are made solely for identification or informational purposes, without implying any affiliation, endorsement, or partnership.
We make no representations or warranties, express or implied, regarding the accuracy, completeness, or suitability of any content or products presented. Nothing on this website should be construed as legal, tax, investment, financial, medical, or other professional advice. In addition, no part of this site—including articles or product references—constitutes a solicitation, recommendation, endorsement, advertisement, or offer to buy or sell any securities, franchises, or other financial instruments, particularly in jurisdictions where such activity would be unlawful.
All content is of a general nature and may not address the specific circumstances of any individual or entity. It is not a substitute for professional advice or services. Any actions you take based on the information provided here are strictly at your own risk. You accept full responsibility for any decisions or outcomes arising from your use of this website and agree to release us from any liability in connection with your use of, or reliance upon, the content or products found herein.