
|
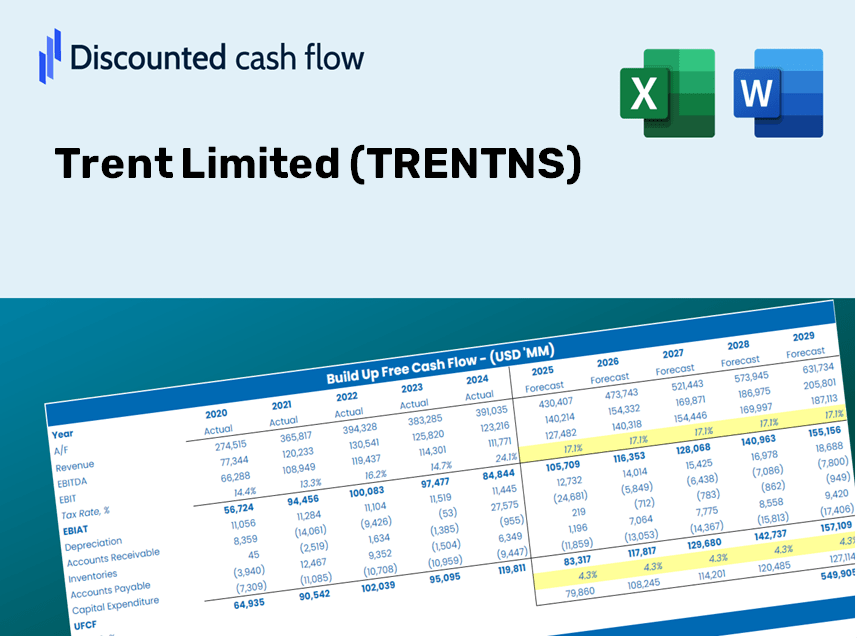
Trent Limited (Trent.NS) DCF -Bewertung |
Fully Editable: Tailor To Your Needs In Excel Or Sheets
Professional Design: Trusted, Industry-Standard Templates
Investor-Approved Valuation Models
MAC/PC Compatible, Fully Unlocked
No Expertise Is Needed; Easy To Follow
Trent Limited (TRENT.NS) Bundle
Unser (Trentns) DCF-Taschenrechner entwickelt für die Genauigkeit und ermöglicht es Ihnen, die Bewertung von Trent Limited mithilfe von Finanzdaten in realer Welt zu bewerten und vollständige Flexibilität für die Änderung aller Schlüsselparameter für verbesserte Projektionen zu bieten.
Discounted Cash Flow (DCF) - (USD MM)
| Year | AY1 2021 |
AY2 2022 |
AY3 2023 |
AY4 2024 |
AY5 2025 |
FY1 2026 |
FY2 2027 |
FY3 2028 |
FY4 2029 |
FY5 2030 |
|---|---|---|---|---|---|---|---|---|---|---|
| Revenue | 25,929.6 | 44,980.2 | 82,420.2 | 123,751.1 | 171,346.1 | 276,430.1 | 445,960.4 | 719,461.2 | 1,160,695.8 | 1,872,532.9 |
| Revenue Growth, % | 0 | 73.47 | 83.24 | 50.15 | 38.46 | 61.33 | 61.33 | 61.33 | 61.33 | 61.33 |
| EBITDA | -226.6 | 3,330.8 | 7,242.7 | 14,766.8 | 21,547.3 | 22,018.6 | 35,522.2 | 57,307.4 | 92,453.2 | 149,153.4 |
| EBITDA, % | -0.8739 | 7.41 | 8.79 | 11.93 | 12.58 | 7.97 | 7.97 | 7.97 | 7.97 | 7.97 |
| Depreciation | 600.6 | 692.8 | 1,435.8 | 2,256.6 | 2,914.6 | 5,043.8 | 8,137.0 | 13,127.4 | 21,178.2 | 34,166.4 |
| Depreciation, % | 2.32 | 1.54 | 1.74 | 1.82 | 1.7 | 1.82 | 1.82 | 1.82 | 1.82 | 1.82 |
| EBIT | -827.2 | 2,638.0 | 5,806.9 | 12,510.2 | 18,632.7 | 16,974.8 | 27,385.2 | 44,180.1 | 71,275.0 | 114,986.9 |
| EBIT, % | -3.19 | 5.86 | 7.05 | 10.11 | 10.87 | 6.14 | 6.14 | 6.14 | 6.14 | 6.14 |
| Total Cash | 7,462.9 | 6,084.9 | 6,289.7 | 10,143.2 | 9,731.6 | 35,281.6 | 56,919.3 | 91,827.1 | 148,143.2 | 238,997.2 |
| Total Cash, percent | .0 | .0 | .0 | .0 | .0 | .0 | .0 | .0 | .0 | .0 |
| Account Receivables | 986.9 | 182.6 | 1,615.2 | 2,497.6 | 809.2 | 4,789.0 | 7,726.0 | 12,464.3 | 20,108.5 | 32,440.7 |
| Account Receivables, % | 3.81 | 0.40596 | 1.96 | 2.02 | 0.47226 | 1.73 | 1.73 | 1.73 | 1.73 | 1.73 |
| Inventories | 4,283.9 | 8,677.8 | 13,611.6 | 15,827.3 | 20,450.5 | 42,599.8 | 68,725.6 | 110,874.0 | 178,871.3 | 288,570.3 |
| Inventories, % | 16.52 | 19.29 | 16.51 | 12.79 | 11.94 | 15.41 | 15.41 | 15.41 | 15.41 | 15.41 |
| Accounts Payable | 2,745.7 | 3,780.3 | 6,652.2 | 7,739.1 | 9,281.9 | 21,415.2 | 34,548.8 | 55,737.1 | 89,919.8 | 145,066.3 |
| Accounts Payable, % | 10.59 | 8.4 | 8.07 | 6.25 | 5.42 | 7.75 | 7.75 | 7.75 | 7.75 | 7.75 |
| Capital Expenditure | -1,133.6 | -2,709.2 | -5,034.0 | -7,369.5 | -12,681.9 | -16,507.9 | -26,631.9 | -42,964.9 | -69,314.6 | -111,824.3 |
| Capital Expenditure, % | -4.37 | -6.02 | -6.11 | -5.96 | -7.4 | -5.97 | -5.97 | -5.97 | -5.97 | -5.97 |
| Tax Rate, % | 23.8 | 23.8 | 23.8 | 23.8 | 23.8 | 23.8 | 23.8 | 23.8 | 23.8 | 23.8 |
| EBITAT | -590.3 | 2,510.2 | 4,676.8 | 9,683.4 | 14,198.7 | 13,602.4 | 21,944.5 | 35,402.8 | 57,114.7 | 92,142.3 |
| Depreciation | ||||||||||
| Changes in Account Receivables | ||||||||||
| Changes in Inventories | ||||||||||
| Changes in Accounts Payable | ||||||||||
| Capital Expenditure | ||||||||||
| UFCF | -3,648.4 | -2,061.2 | -2,415.9 | 2,559.3 | 3,039.4 | -11,857.5 | -12,479.6 | -20,133.1 | -32,480.5 | -52,400.3 |
| WACC, % | 4.71 | 4.74 | 4.72 | 4.72 | 4.71 | 4.72 | 4.72 | 4.72 | 4.72 | 4.72 |
| PV UFCF | ||||||||||
| SUM PV UFCF | -108,857.7 | |||||||||
| Long Term Growth Rate, % | 4.00 | |||||||||
| Free cash flow (T + 1) | -54,496 | |||||||||
| Terminal Value | -7,583,856 | |||||||||
| Present Terminal Value | -6,022,424 | |||||||||
| Enterprise Value | -6,131,281 | |||||||||
| Net Debt | 18,987 | |||||||||
| Equity Value | -6,150,269 | |||||||||
| Diluted Shares Outstanding, MM | 355 | |||||||||
| Equity Value Per Share | -17,300.97 |
What You Will Receive
- Customizable Excel Template: A fully adaptable Excel-based DCF Calculator featuring pre-populated financial data for TRENT Limited (TRENTNS).
- Actual Financial Data: Access to historical data and forward-looking projections (as displayed in the highlighted cells).
- Flexible Forecasting: Modify forecast parameters such as revenue growth, EBITDA margin, and WACC as needed.
- Instant Calculations: Quickly observe how your inputs affect the valuation of TRENT Limited (TRENTNS).
- Professional Resource: Designed for use by investors, CFOs, consultants, and financial analysts alike.
- Easy-to-Use Layout: Organized for clarity and simplicity, complete with step-by-step guidance.
Key Features
- 🔍 Real-Life TRENTNS Financials: Pre-filled historical and projected data for Trent Limited.
- ✏️ Fully Customizable Inputs: Adjust all critical parameters (yellow cells) such as WACC, growth %, and tax rates.
- 📊 Professional DCF Valuation: Built-in formulas calculate Trent Limited’s intrinsic value using the Discounted Cash Flow method.
- ⚡ Instant Results: Visualize Trent Limited’s valuation instantly after making adjustments.
- Scenario Analysis: Test and compare outcomes for different financial assumptions side-by-side.
How It Works
- Download the Template: Gain immediate access to the Excel-based TRENTNS DCF Calculator.
- Input Your Assumptions: Modify the yellow-highlighted cells for growth rates, WACC, margins, and other variables.
- Instant Calculations: The model automatically calculates the intrinsic value of Trent Limited.
- Test Scenarios: Explore different assumptions to see how valuations might change.
- Analyze and Decide: Leverage the results to inform your investment or financial analysis.
Why Opt for This Calculator?
- Designed for Experts: A sophisticated tool utilized by analysts, CFOs, and financial consultants.
- Accurate Data Insights: Historical and projected financials for Trent Limited (TRENTNS) preloaded for precise analysis.
- Flexible Scenario Analysis: Effortlessly test various forecasts and assumptions.
- Concise Results: Automatically computes intrinsic value, NPV, and essential financial metrics.
- User-Friendly: Detailed step-by-step instructions to assist you throughout the process.
Who Can Benefit from Trent Limited (TRENTNS)?
- Investors: Empower your investment choices with our expert-level valuation tool.
- Financial Analysts: Streamline your workflow with a customizable DCF model at your fingertips.
- Consultants: Efficiently modify the template for client reports and presentations.
- Finance Enthusiasts: Enhance your valuation skills by exploring practical examples.
- Educators and Students: Leverage this resource as a hands-on learning tool in finance studies.
Contents of the Template
- Pre-Filled DCF Model: Trent Limited’s financial data preloaded for immediate analysis.
- WACC Calculator: Comprehensive calculations for Weighted Average Cost of Capital.
- Financial Ratios: Assess Trent Limited’s profitability, leverage, and operational efficiency.
- Editable Inputs: Modify assumptions like growth rates, profit margins, and CAPEX to suit your analysis.
- Financial Statements: Access annual and quarterly reports for in-depth evaluation.
- Interactive Dashboard: Effortlessly visualize essential valuation metrics and outcomes.
Disclaimer
All information, articles, and product details provided on this website are for general informational and educational purposes only. We do not claim any ownership over, nor do we intend to infringe upon, any trademarks, copyrights, logos, brand names, or other intellectual property mentioned or depicted on this site. Such intellectual property remains the property of its respective owners, and any references here are made solely for identification or informational purposes, without implying any affiliation, endorsement, or partnership.
We make no representations or warranties, express or implied, regarding the accuracy, completeness, or suitability of any content or products presented. Nothing on this website should be construed as legal, tax, investment, financial, medical, or other professional advice. In addition, no part of this site—including articles or product references—constitutes a solicitation, recommendation, endorsement, advertisement, or offer to buy or sell any securities, franchises, or other financial instruments, particularly in jurisdictions where such activity would be unlawful.
All content is of a general nature and may not address the specific circumstances of any individual or entity. It is not a substitute for professional advice or services. Any actions you take based on the information provided here are strictly at your own risk. You accept full responsibility for any decisions or outcomes arising from your use of this website and agree to release us from any liability in connection with your use of, or reliance upon, the content or products found herein.