
|
Trex Company, Inc. (Trex) DCF -Bewertung |
Fully Editable: Tailor To Your Needs In Excel Or Sheets
Professional Design: Trusted, Industry-Standard Templates
Investor-Approved Valuation Models
MAC/PC Compatible, Fully Unlocked
No Expertise Is Needed; Easy To Follow
Trex Company, Inc. (TREX) Bundle
Optimieren Sie Ihre Zeit und verbessern Sie die Präzision mit unserem (Trex) DCF -Taschenrechner! Mithilfe der tatsächlichen Trex -Unternehmensdaten und anpassbaren Annahmen können Sie mit diesem Tool wie ein erfahrener Investor Trex Company, Inc. prognostizieren, analysieren und bewerten.
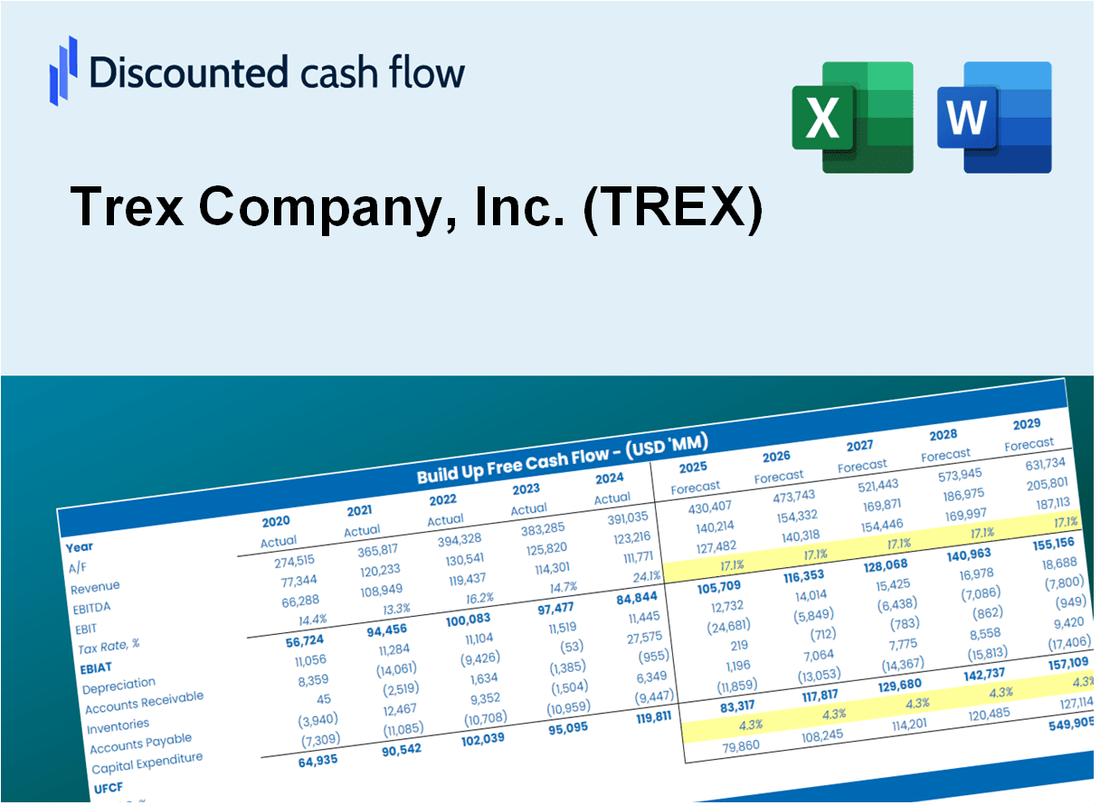
Discounted Cash Flow (DCF) - (USD MM)
| Year | AY1 2020 |
AY2 2021 |
AY3 2022 |
AY4 2023 |
AY5 2024 |
FY1 2025 |
FY2 2026 |
FY3 2027 |
FY4 2028 |
FY5 2029 |
|---|---|---|---|---|---|---|---|---|---|---|
| Revenue | 880.8 | 1,197.0 | 1,106.0 | 1,094.8 | 1,151.4 | 1,244.9 | 1,345.9 | 1,455.0 | 1,573.1 | 1,700.7 |
| Revenue Growth, % | 0 | 35.89 | -7.6 | -1.01 | 5.17 | 8.11 | 8.11 | 8.11 | 8.11 | 8.11 |
| EBITDA | 251.6 | 356.8 | 306.5 | 326.4 | 360.3 | 366.5 | 396.2 | 428.3 | 463.1 | 500.6 |
| EBITDA, % | 28.56 | 29.81 | 27.71 | 29.81 | 31.29 | 29.44 | 29.44 | 29.44 | 29.44 | 29.44 |
| Depreciation | 17.9 | 35.9 | 44.3 | 50.2 | 54.7 | 45.8 | 49.5 | 53.5 | 57.8 | 62.5 |
| Depreciation, % | 2.04 | 3 | 4.01 | 4.58 | 4.75 | 3.68 | 3.68 | 3.68 | 3.68 | 3.68 |
| EBIT | 233.6 | 320.9 | 262.2 | 276.2 | 305.7 | 320.7 | 346.7 | 374.8 | 405.3 | 438.1 |
| EBIT, % | 26.52 | 26.81 | 23.7 | 25.23 | 26.55 | 25.76 | 25.76 | 25.76 | 25.76 | 25.76 |
| Total Cash | 121.7 | 141.1 | 12.3 | 2.0 | 1.3 | 67.2 | 72.7 | 78.6 | 85.0 | 91.9 |
| Total Cash, percent | .0 | .0 | .0 | .0 | .0 | .0 | .0 | .0 | .0 | .0 |
| Account Receivables | 123.5 | 160.6 | 98.1 | 50.7 | 88.4 | 121.0 | 130.8 | 141.5 | 152.9 | 165.3 |
| Account Receivables, % | 14.02 | 13.42 | 8.87 | 4.64 | 7.67 | 9.72 | 9.72 | 9.72 | 9.72 | 9.72 |
| Inventories | 68.2 | 83.8 | 141.4 | 107.1 | 207.3 | 137.7 | 148.9 | 161.0 | 174.0 | 188.1 |
| Inventories, % | 7.75 | 7 | 12.78 | 9.78 | 18 | 11.06 | 11.06 | 11.06 | 11.06 | 11.06 |
| Accounts Payable | 38.6 | 24.9 | 19.9 | 24.0 | 61.3 | 39.3 | 42.5 | 45.9 | 49.6 | 53.7 |
| Accounts Payable, % | 4.38 | 2.08 | 1.8 | 2.19 | 5.32 | 3.15 | 3.15 | 3.15 | 3.15 | 3.15 |
| Capital Expenditure | -172.8 | -159.4 | -176.2 | -166.1 | -236.6 | -210.6 | -227.7 | -246.2 | -266.1 | -287.7 |
| Capital Expenditure, % | -19.62 | -13.32 | -15.93 | -15.17 | -20.55 | -16.92 | -16.92 | -16.92 | -16.92 | -16.92 |
| Tax Rate, % | 25.94 | 25.94 | 25.94 | 25.94 | 25.94 | 25.94 | 25.94 | 25.94 | 25.94 | 25.94 |
| EBITAT | 174.9 | 243.2 | 196.1 | 205.4 | 226.4 | 239.8 | 259.3 | 280.3 | 303.0 | 327.6 |
| Depreciation | ||||||||||
| Changes in Account Receivables | ||||||||||
| Changes in Inventories | ||||||||||
| Changes in Accounts Payable | ||||||||||
| Capital Expenditure | ||||||||||
| UFCF | -133.1 | 53.3 | 64.2 | 175.1 | -56.1 | 89.9 | 63.2 | 68.3 | 73.9 | 79.9 |
| WACC, % | 10.51 | 10.51 | 10.51 | 10.51 | 10.51 | 10.51 | 10.51 | 10.51 | 10.51 | 10.51 |
| PV UFCF | ||||||||||
| SUM PV UFCF | 281.8 | |||||||||
| Long Term Growth Rate, % | 4.00 | |||||||||
| Free cash flow (T + 1) | 83 | |||||||||
| Terminal Value | 1,277 | |||||||||
| Present Terminal Value | 775 | |||||||||
| Enterprise Value | 1,056 | |||||||||
| Net Debt | 254 | |||||||||
| Equity Value | 802 | |||||||||
| Diluted Shares Outstanding, MM | 108 | |||||||||
| Equity Value Per Share | 7.41 |
What You Will Get
- Editable Forecast Inputs: Easily modify key assumptions (growth %, margins, WACC) to explore various scenarios.
- Real-World Data: Trex Company, Inc.'s (TREX) financial data pre-filled to accelerate your analysis.
- Automatic DCF Outputs: The template computes Net Present Value (NPV) and intrinsic value for you effortlessly.
- Customizable and Professional: A sleek Excel model that can be tailored to meet your valuation requirements.
- Built for Analysts and Investors: Perfect for evaluating projections, confirming strategies, and optimizing efficiency.
Key Features
- Comprehensive Trex Financials: Gain access to precise pre-loaded historical data and future forecasts.
- Adjustable Forecast Parameters: Modify yellow-highlighted fields such as WACC, growth rates, and profit margins.
- Real-Time Calculations: Automatic updates for DCF, Net Present Value (NPV), and cash flow assessments.
- Interactive Dashboard: User-friendly charts and summaries to help visualize your valuation outcomes.
- Suitable for All Levels: A straightforward, intuitive design tailored for investors, CFOs, and consultants alike.
How It Works
- Step 1: Download the prebuilt Excel template featuring Trex Company, Inc.'s (TREX) data.
- Step 2: Navigate through the pre-filled sheets to familiarize yourself with the essential metrics.
- Step 3: Modify forecasts and assumptions in the editable yellow cells (WACC, growth, margins).
- Step 4: Immediately see recalculated results, including Trex Company, Inc.'s (TREX) intrinsic value.
- Step 5: Utilize the outputs to make well-informed investment choices or create reports.
Why Choose This Calculator for Trex Company, Inc. (TREX)?
- Accurate Data: Up-to-date Trex financials provide trustworthy valuation outcomes.
- Customizable: Modify essential parameters like growth rates, WACC, and tax rates to fit your forecasts.
- Time-Saving: Pre-configured calculations save you the hassle of starting from the ground up.
- Professional-Grade Tool: Tailored for investors, analysts, and consultants in the industry.
- User-Friendly: Easy-to-navigate design and clear instructions make it accessible for all users.
Who Should Use This Product?
- Environmental Students: Explore sustainable building practices and analyze Trex's eco-friendly products.
- Researchers: Utilize Trex's innovative materials in studies related to sustainability and construction.
- Investors: Evaluate your investment strategies and assess the market performance of Trex Company, Inc. (TREX).
- Construction Professionals: Enhance your projects with a reliable source of high-performance composite materials.
- Homeowners: Discover how Trex’s products can improve your outdoor living spaces with durability and style.
What the Template Contains
- Pre-Filled Data: Includes Trex Company, Inc.’s historical financials and forecasts.
- Discounted Cash Flow Model: Editable DCF valuation model with automatic calculations.
- Weighted Average Cost of Capital (WACC): A dedicated sheet for calculating WACC based on custom inputs.
- Key Financial Ratios: Analyze Trex’s profitability, efficiency, and leverage.
- Customizable Inputs: Edit revenue growth, margins, and tax rates with ease.
- Clear Dashboard: Charts and tables summarizing key valuation results.
Disclaimer
All information, articles, and product details provided on this website are for general informational and educational purposes only. We do not claim any ownership over, nor do we intend to infringe upon, any trademarks, copyrights, logos, brand names, or other intellectual property mentioned or depicted on this site. Such intellectual property remains the property of its respective owners, and any references here are made solely for identification or informational purposes, without implying any affiliation, endorsement, or partnership.
We make no representations or warranties, express or implied, regarding the accuracy, completeness, or suitability of any content or products presented. Nothing on this website should be construed as legal, tax, investment, financial, medical, or other professional advice. In addition, no part of this site—including articles or product references—constitutes a solicitation, recommendation, endorsement, advertisement, or offer to buy or sell any securities, franchises, or other financial instruments, particularly in jurisdictions where such activity would be unlawful.
All content is of a general nature and may not address the specific circumstances of any individual or entity. It is not a substitute for professional advice or services. Any actions you take based on the information provided here are strictly at your own risk. You accept full responsibility for any decisions or outcomes arising from your use of this website and agree to release us from any liability in connection with your use of, or reliance upon, the content or products found herein.