
|
Trimble Inc. (TRMB) DCF -Bewertung |
Fully Editable: Tailor To Your Needs In Excel Or Sheets
Professional Design: Trusted, Industry-Standard Templates
Investor-Approved Valuation Models
MAC/PC Compatible, Fully Unlocked
No Expertise Is Needed; Easy To Follow
Trimble Inc. (TRMB) Bundle
Vereinfachen Sie die Bewertung der Trimble Inc. (TRMB) mit diesem anpassbaren DCF -Taschenrechner! Mit Real Trimble Inc. (TRMB) -Fonds und einstellbaren Prognoseeingängen können Sie Szenarien testen und Trimble Inc. (TRMB) in wenigen Minuten aufdecken.
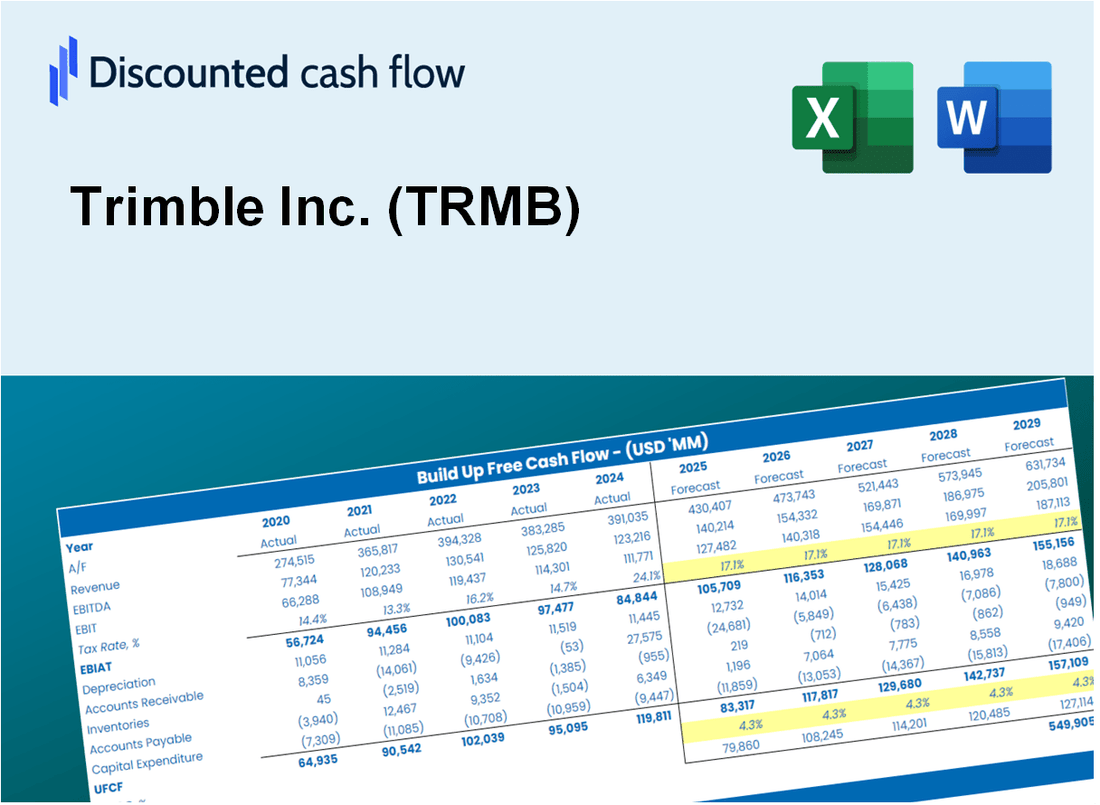
Discounted Cash Flow (DCF) - (USD MM)
| Year | AY1 2020 |
AY2 2021 |
AY3 2022 |
AY4 2023 |
AY5 2024 |
FY1 2025 |
FY2 2026 |
FY3 2027 |
FY4 2028 |
FY5 2029 |
|---|---|---|---|---|---|---|---|---|---|---|
| Revenue | 3,147.7 | 3,659.1 | 3,676.3 | 3,798.7 | 3,683.3 | 3,839.9 | 4,003.2 | 4,173.4 | 4,350.9 | 4,535.9 |
| Revenue Growth, % | 0 | 16.25 | 0.47006 | 3.33 | -3.04 | 4.25 | 4.25 | 4.25 | 4.25 | 4.25 |
| EBITDA | 692.9 | 819.9 | 747.4 | 768.6 | 2,328.6 | 1,138.2 | 1,186.6 | 1,237.0 | 1,289.6 | 1,344.5 |
| EBITDA, % | 22.01 | 22.41 | 20.33 | 20.23 | 63.22 | 29.64 | 29.64 | 29.64 | 29.64 | 29.64 |
| Depreciation | 220.3 | 179.9 | 171.8 | 250.6 | 232.0 | 226.4 | 236.1 | 246.1 | 256.6 | 267.5 |
| Depreciation, % | 7 | 4.92 | 4.67 | 6.6 | 6.3 | 5.9 | 5.9 | 5.9 | 5.9 | 5.9 |
| EBIT | 472.6 | 640.0 | 575.6 | 518.0 | 2,096.6 | 911.7 | 950.5 | 990.9 | 1,033.1 | 1,077.0 |
| EBIT, % | 15.01 | 17.49 | 15.66 | 13.64 | 56.92 | 23.74 | 23.74 | 23.74 | 23.74 | 23.74 |
| Total Cash | 237.7 | 325.7 | 271.0 | 229.8 | 738.8 | 383.5 | 399.8 | 416.8 | 434.5 | 453.0 |
| Total Cash, percent | .0 | .0 | .0 | .0 | .0 | .0 | .0 | .0 | .0 | .0 |
| Account Receivables | 620.5 | 624.8 | 643.3 | 706.6 | 725.8 | 711.1 | 741.3 | 772.9 | 805.7 | 840.0 |
| Account Receivables, % | 19.71 | 17.08 | 17.5 | 18.6 | 19.71 | 18.52 | 18.52 | 18.52 | 18.52 | 18.52 |
| Inventories | 301.7 | 363.3 | 402.5 | 235.7 | 194.3 | 322.1 | 335.8 | 350.1 | 365.0 | 380.5 |
| Inventories, % | 9.58 | 9.93 | 10.95 | 6.2 | 5.28 | 8.39 | 8.39 | 8.39 | 8.39 | 8.39 |
| Accounts Payable | 143.2 | 207.3 | 175.5 | 165.3 | 161.6 | 182.2 | 190.0 | 198.0 | 206.5 | 215.2 |
| Accounts Payable, % | 4.55 | 5.67 | 4.77 | 4.35 | 4.39 | 4.75 | 4.75 | 4.75 | 4.75 | 4.75 |
| Capital Expenditure | -56.8 | -46.1 | -43.2 | -42.0 | -33.6 | -48.1 | -50.1 | -52.2 | -54.4 | -56.8 |
| Capital Expenditure, % | -1.8 | -1.26 | -1.18 | -1.11 | -0.91223 | -1.25 | -1.25 | -1.25 | -1.25 | -1.25 |
| Tax Rate, % | 25 | 25 | 25 | 25 | 25 | 25 | 25 | 25 | 25 | 25 |
| EBITAT | 466.5 | 548.9 | 454.8 | 451.7 | 1,572.4 | 776.2 | 809.3 | 843.7 | 879.5 | 916.9 |
| Depreciation | ||||||||||
| Changes in Account Receivables | ||||||||||
| Changes in Inventories | ||||||||||
| Changes in Accounts Payable | ||||||||||
| Capital Expenditure | ||||||||||
| UFCF | -149.0 | 680.9 | 493.9 | 753.6 | 1,789.3 | 862.1 | 959.0 | 999.8 | 1,042.3 | 1,086.6 |
| WACC, % | 10.92 | 10.86 | 10.83 | 10.87 | 10.81 | 10.86 | 10.86 | 10.86 | 10.86 | 10.86 |
| PV UFCF | ||||||||||
| SUM PV UFCF | 3,631.2 | |||||||||
| Long Term Growth Rate, % | 4.00 | |||||||||
| Free cash flow (T + 1) | 1,130 | |||||||||
| Terminal Value | 16,483 | |||||||||
| Present Terminal Value | 9,845 | |||||||||
| Enterprise Value | 13,476 | |||||||||
| Net Debt | 775 | |||||||||
| Equity Value | 12,701 | |||||||||
| Diluted Shares Outstanding, MM | 247 | |||||||||
| Equity Value Per Share | 51.38 |
What You Will Receive
- Customizable Excel Template: A fully editable Excel-based DCF Calculator featuring pre-filled financials for Trimble Inc. (TRMB).
- Actual Data: Access to historical performance metrics and forward-looking projections (highlighted in the yellow cells).
- Forecasting Options: Adjust key assumptions like revenue growth, EBITDA %, and WACC to suit your analysis.
- Instant Calculations: Quickly observe how your inputs affect the valuation of Trimble Inc. (TRMB).
- Professional Resource: Designed for investors, CFOs, consultants, and financial analysts.
- User-Centric Layout: Organized for simplicity and efficiency, complete with detailed instructions.
Key Features
- Comprehensive Data: Trimble Inc.'s historical financial statements and pre-filled projections.
- Customizable Inputs: Modify WACC, tax rates, revenue growth, and EBITDA margins as needed.
- Real-Time Results: Observe Trimble Inc.'s intrinsic value recalculating instantly.
- Intuitive Visual Outputs: Dashboard charts illustrate valuation results and important metrics.
- Designed for Precision: A professional solution tailored for analysts, investors, and finance professionals.
How It Works
- Download the Template: Gain immediate access to the Excel-based TRMB DCF Calculator.
- Input Your Assumptions: Modify the yellow-highlighted cells for growth rates, WACC, margins, and more.
- Instant Calculations: The model automatically recalculates Trimble Inc.'s intrinsic value.
- Test Scenarios: Experiment with various assumptions to assess potential valuation fluctuations.
- Analyze and Decide: Leverage the results to inform your investment or financial analysis.
Why Choose This Calculator for Trimble Inc. (TRMB)?
- All-in-One Solution: Features DCF, WACC, and financial ratio analyses tailored for Trimble Inc. (TRMB).
- Flexible Inputs: Modify yellow-highlighted cells to explore different financial scenarios.
- In-Depth Analysis: Automatically computes Trimble Inc. (TRMB)’s intrinsic value and Net Present Value.
- Data Ready: Comes with historical and projected data for reliable starting points.
- High-Quality Standards: Perfect for financial analysts, investors, and business consultants focused on Trimble Inc. (TRMB).
Who Should Use This Product?
- Investors: Accurately evaluate Trimble Inc.'s (TRMB) fair value prior to making investment choices.
- CFOs: Utilize a high-quality DCF model for financial analysis and reporting.
- Consultants: Quickly modify the template for client valuation reports.
- Entrepreneurs: Acquire insights into financial modeling practices employed by leading corporations.
- Educators: Apply it as a resource to illustrate valuation techniques in the classroom.
What the Template Contains
- Pre-Filled Data: Includes Trimble Inc.'s historical financials and forecasts.
- Discounted Cash Flow Model: Editable DCF valuation model with automatic calculations.
- Weighted Average Cost of Capital (WACC): A dedicated sheet for calculating WACC based on custom inputs.
- Key Financial Ratios: Analyze Trimble Inc.'s profitability, efficiency, and leverage.
- Customizable Inputs: Edit revenue growth, margins, and tax rates with ease.
- Clear Dashboard: Charts and tables summarizing key valuation results.
Disclaimer
All information, articles, and product details provided on this website are for general informational and educational purposes only. We do not claim any ownership over, nor do we intend to infringe upon, any trademarks, copyrights, logos, brand names, or other intellectual property mentioned or depicted on this site. Such intellectual property remains the property of its respective owners, and any references here are made solely for identification or informational purposes, without implying any affiliation, endorsement, or partnership.
We make no representations or warranties, express or implied, regarding the accuracy, completeness, or suitability of any content or products presented. Nothing on this website should be construed as legal, tax, investment, financial, medical, or other professional advice. In addition, no part of this site—including articles or product references—constitutes a solicitation, recommendation, endorsement, advertisement, or offer to buy or sell any securities, franchises, or other financial instruments, particularly in jurisdictions where such activity would be unlawful.
All content is of a general nature and may not address the specific circumstances of any individual or entity. It is not a substitute for professional advice or services. Any actions you take based on the information provided here are strictly at your own risk. You accept full responsibility for any decisions or outcomes arising from your use of this website and agree to release us from any liability in connection with your use of, or reliance upon, the content or products found herein.