
|
T. Rowe Price Group, Inc. (Trow) DCF -Bewertung |
Fully Editable: Tailor To Your Needs In Excel Or Sheets
Professional Design: Trusted, Industry-Standard Templates
Investor-Approved Valuation Models
MAC/PC Compatible, Fully Unlocked
No Expertise Is Needed; Easy To Follow
T. Rowe Price Group, Inc. (TROW) Bundle
Vereinfachen Sie die Bewertung der T. Rowe Price Group, Inc. (Trow) mit diesem anpassbaren DCF -Taschenrechner! Mit Real T. Rowe Price Group, Inc. (Trow) Finanzdaten und einstellbaren Prognoseeingaben können Sie Szenarien testen und die beizulegende Zeit des T. Rowe Price Group, Inc. (Trow) in Minuten aufdecken.
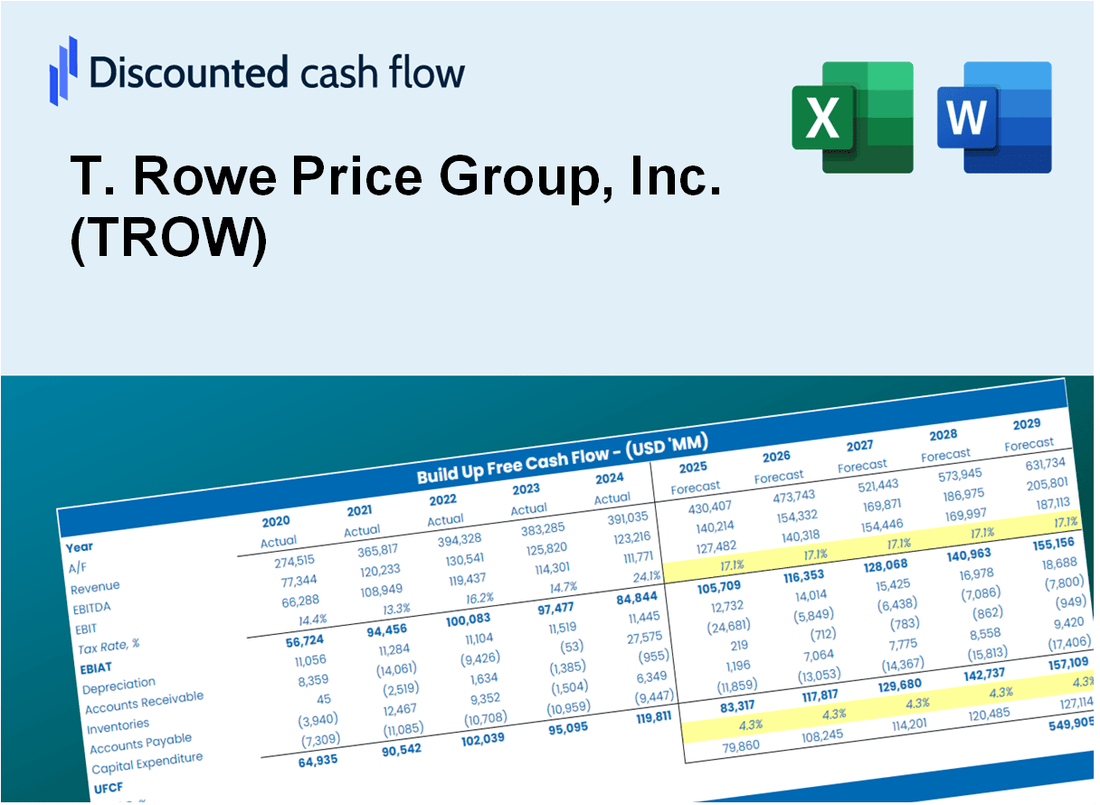
Discounted Cash Flow (DCF) - (USD MM)
| Year | AY1 2020 |
AY2 2021 |
AY3 2022 |
AY4 2023 |
AY5 2024 |
FY1 2025 |
FY2 2026 |
FY3 2027 |
FY4 2028 |
FY5 2029 |
|---|---|---|---|---|---|---|---|---|---|---|
| Revenue | 6,206.7 | 7,671.9 | 6,488.4 | 6,460.5 | 7,093.6 | 7,404.8 | 7,729.7 | 8,068.9 | 8,422.9 | 8,792.4 |
| Revenue Growth, % | 0 | 23.61 | -15.43 | -0.43 | 9.8 | 4.39 | 4.39 | 4.39 | 4.39 | 4.39 |
| EBITDA | 2,935.3 | 3,914.8 | 3,141.8 | 2,519.6 | 2,980.8 | 3,373.1 | 3,521.1 | 3,675.6 | 3,836.8 | 4,005.2 |
| EBITDA, % | 47.29 | 51.03 | 48.42 | 39 | 42.02 | 45.55 | 45.55 | 45.55 | 45.55 | 45.55 |
| Depreciation | 189.6 | 204.8 | 645.8 | 481.6 | 504.2 | 447.8 | 467.5 | 488.0 | 509.4 | 531.8 |
| Depreciation, % | 3.05 | 2.67 | 9.95 | 7.45 | 7.11 | 6.05 | 6.05 | 6.05 | 6.05 | 6.05 |
| EBIT | 2,745.7 | 3,710.0 | 2,496.0 | 2,038.0 | 2,476.6 | 2,925.3 | 3,053.6 | 3,187.6 | 3,327.4 | 3,473.4 |
| EBIT, % | 44.24 | 48.36 | 38.47 | 31.55 | 34.91 | 39.5 | 39.5 | 39.5 | 39.5 | 39.5 |
| Total Cash | 2,151.7 | 1,523.1 | 1,755.6 | 2,066.6 | 2,649.8 | 2,235.1 | 2,333.2 | 2,435.5 | 2,542.4 | 2,653.9 |
| Total Cash, percent | .0 | .0 | .0 | .0 | .0 | .0 | .0 | .0 | .0 | .0 |
| Account Receivables | 863.1 | 1,058.3 | 748.7 | 807.9 | 877.4 | 949.5 | 991.2 | 1,034.6 | 1,080.0 | 1,127.4 |
| Account Receivables, % | 13.91 | 13.79 | 11.54 | 12.51 | 12.37 | 12.82 | 12.82 | 12.82 | 12.82 | 12.82 |
| Inventories | .0 | .0 | .0 | .0 | .0 | .0 | .0 | .0 | .0 | .0 |
| Inventories, % | 0 | 0 | 0 | 0 | 0 | 0 | 0 | 0 | 0 | 0 |
| Accounts Payable | 100.2 | 431.0 | 406.7 | 422.9 | 353.5 | 370.7 | 386.9 | 403.9 | 421.6 | 440.1 |
| Accounts Payable, % | 1.61 | 5.62 | 6.27 | 6.55 | 4.98 | 5.01 | 5.01 | 5.01 | 5.01 | 5.01 |
| Capital Expenditure | -214.6 | -239.1 | -237.6 | -307.9 | -423.4 | -310.6 | -324.2 | -338.4 | -353.3 | -368.8 |
| Capital Expenditure, % | -3.46 | -3.12 | -3.66 | -4.77 | -5.97 | -4.19 | -4.19 | -4.19 | -4.19 | -4.19 |
| Tax Rate, % | 25.52 | 25.52 | 25.52 | 25.52 | 25.52 | 25.52 | 25.52 | 25.52 | 25.52 | 25.52 |
| EBITAT | 2,009.4 | 2,863.3 | 1,996.0 | 1,463.8 | 1,844.6 | 2,203.5 | 2,300.2 | 2,401.1 | 2,506.4 | 2,616.4 |
| Depreciation | ||||||||||
| Changes in Account Receivables | ||||||||||
| Changes in Inventories | ||||||||||
| Changes in Accounts Payable | ||||||||||
| Capital Expenditure | ||||||||||
| UFCF | 1,221.5 | 2,964.6 | 2,689.5 | 1,594.5 | 1,786.5 | 2,285.8 | 2,418.1 | 2,524.2 | 2,634.9 | 2,750.5 |
| WACC, % | 10.91 | 10.91 | 10.91 | 10.91 | 10.91 | 10.91 | 10.91 | 10.91 | 10.91 | 10.91 |
| PV UFCF | ||||||||||
| SUM PV UFCF | 9,257.3 | |||||||||
| Long Term Growth Rate, % | 2.00 | |||||||||
| Free cash flow (T + 1) | 2,806 | |||||||||
| Terminal Value | 31,489 | |||||||||
| Present Terminal Value | 18,764 | |||||||||
| Enterprise Value | 28,021 | |||||||||
| Net Debt | -2,371 | |||||||||
| Equity Value | 30,392 | |||||||||
| Diluted Shares Outstanding, MM | 223 | |||||||||
| Equity Value Per Share | 136.10 |
What You Will Get
- Editable Excel Template: A fully customizable Excel-based DCF Calculator featuring pre-filled real T. Rowe Price Group, Inc. (TROW) financials.
- Real-World Data: Historical data and forward-looking estimates (as indicated in the yellow cells).
- Forecast Flexibility: Adjust forecast assumptions such as revenue growth, EBITDA %, and WACC.
- Automatic Calculations: Instantly observe how your inputs affect T. Rowe Price Group, Inc. (TROW)’s valuation.
- Professional Tool: Designed for investors, CFOs, consultants, and financial analysts.
- User-Friendly Design: Organized for clarity and ease of use, complete with step-by-step instructions.
Key Features
- Comprehensive Historical Data: T. Rowe Price Group's (TROW) extensive financial statements and detailed forecasts.
- Customizable Variables: Adjust parameters such as WACC, tax rates, revenue growth, and EBITDA margins to suit your analysis.
- Real-Time Valuation: Instantly view T. Rowe Price Group's intrinsic value as it updates live.
- Intuitive Visual Representations: Engaging dashboard charts provide clear insights into valuation outcomes and essential metrics.
- Designed for Precision: A trusted resource for analysts, investors, and finance professionals seeking accuracy.
How It Works
- Step 1: Download the Excel file for T. Rowe Price Group, Inc. (TROW).
- Step 2: Review T. Rowe Price's pre-filled financial data and projections.
- Step 3: Adjust key inputs such as revenue growth, WACC, and tax rates (highlighted cells).
- Step 4: Observe the DCF model update in real-time as you modify assumptions.
- Step 5: Evaluate the outputs and leverage the results for your investment strategies.
Why Choose This Calculator for T. Rowe Price Group, Inc. (TROW)?
- Designed for Financial Experts: A sophisticated tool utilized by investment analysts, portfolio managers, and financial advisors.
- Comprehensive Data: T. Rowe Price’s historical and forecasted financials are preloaded for precise analysis.
- Versatile Scenario Analysis: Effortlessly test various investment scenarios and assumptions.
- Insightful Outputs: Automatically computes intrinsic value, NPV, and other crucial financial metrics.
- User-Friendly Interface: Step-by-step guidance simplifies the calculation process.
Who Should Use T. Rowe Price Group, Inc. (TROW)?
- Investors: Gain insights and make informed investment choices with T. Rowe Price's expert resources.
- Financial Advisors: Leverage comprehensive tools and research to enhance client portfolios.
- Wealth Managers: Utilize tailored strategies to meet diverse client needs efficiently.
- Market Analysts: Access in-depth market analysis to support investment recommendations.
- Students and Educators: Explore practical investment strategies and financial concepts in academic settings.
What the Template Contains
- Pre-Filled DCF Model: T. Rowe Price’s financial data preloaded for immediate use.
- WACC Calculator: Detailed calculations for Weighted Average Cost of Capital.
- Financial Ratios: Evaluate T. Rowe Price’s profitability, leverage, and efficiency.
- Editable Inputs: Change assumptions such as growth, margins, and CAPEX to fit your scenarios.
- Financial Statements: Annual and quarterly reports to support detailed analysis.
- Interactive Dashboard: Easily visualize key valuation metrics and results.
Disclaimer
All information, articles, and product details provided on this website are for general informational and educational purposes only. We do not claim any ownership over, nor do we intend to infringe upon, any trademarks, copyrights, logos, brand names, or other intellectual property mentioned or depicted on this site. Such intellectual property remains the property of its respective owners, and any references here are made solely for identification or informational purposes, without implying any affiliation, endorsement, or partnership.
We make no representations or warranties, express or implied, regarding the accuracy, completeness, or suitability of any content or products presented. Nothing on this website should be construed as legal, tax, investment, financial, medical, or other professional advice. In addition, no part of this site—including articles or product references—constitutes a solicitation, recommendation, endorsement, advertisement, or offer to buy or sell any securities, franchises, or other financial instruments, particularly in jurisdictions where such activity would be unlawful.
All content is of a general nature and may not address the specific circumstances of any individual or entity. It is not a substitute for professional advice or services. Any actions you take based on the information provided here are strictly at your own risk. You accept full responsibility for any decisions or outcomes arising from your use of this website and agree to release us from any liability in connection with your use of, or reliance upon, the content or products found herein.