
|
Truecar, Inc. (True) DCF -Bewertung |
Fully Editable: Tailor To Your Needs In Excel Or Sheets
Professional Design: Trusted, Industry-Standard Templates
Investor-Approved Valuation Models
MAC/PC Compatible, Fully Unlocked
No Expertise Is Needed; Easy To Follow
TrueCar, Inc. (TRUE) Bundle
Gewinnen Sie einen Einblick in Ihre Bewertungsanalyse von Truecar, Inc. (True) mit unserem hochmodernen DCF-Taschenrechner! Diese Excel -Vorlage mit echten echten Daten ermöglicht es Ihnen, Prognosen und Annahmen anzupassen, um den inneren Wert von Truecar genau zu berechnen.
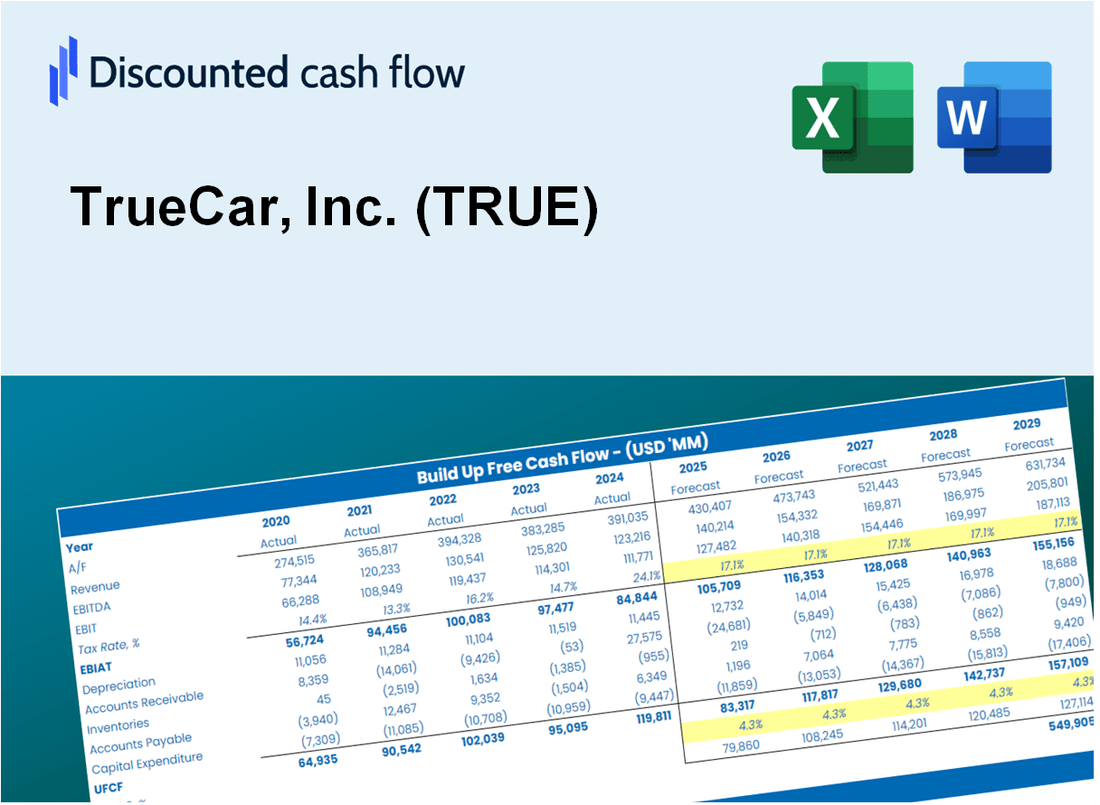
Discounted Cash Flow (DCF) - (USD MM)
| Year | AY1 2020 |
AY2 2021 |
AY3 2022 |
AY4 2023 |
AY5 2024 |
FY1 2025 |
FY2 2026 |
FY3 2027 |
FY4 2028 |
FY5 2029 |
|---|---|---|---|---|---|---|---|---|---|---|
| Revenue | 278.7 | 231.7 | 161.5 | 158.7 | 175.6 | 158.8 | 143.6 | 129.9 | 117.5 | 106.2 |
| Revenue Growth, % | 0 | -16.86 | -30.29 | -1.74 | 10.64 | -9.56 | -9.56 | -9.56 | -9.56 | -9.56 |
| EBITDA | 6.1 | -17.6 | -45.5 | -35.8 | -18.2 | -21.1 | -19.1 | -17.3 | -15.6 | -14.1 |
| EBITDA, % | 2.19 | -7.59 | -28.14 | -22.55 | -10.35 | -13.29 | -13.29 | -13.29 | -13.29 | -13.29 |
| Depreciation | 26.0 | 20.6 | 20.5 | 20.7 | 19.0 | 17.4 | 15.7 | 14.2 | 12.9 | 11.6 |
| Depreciation, % | 9.31 | 8.88 | 12.67 | 13.03 | 10.82 | 10.94 | 10.94 | 10.94 | 10.94 | 10.94 |
| EBIT | -19.8 | -38.2 | -65.9 | -56.5 | -37.2 | -38.5 | -34.8 | -31.5 | -28.5 | -25.7 |
| EBIT, % | -7.12 | -16.47 | -40.81 | -35.58 | -21.17 | -24.23 | -24.23 | -24.23 | -24.23 | -24.23 |
| Total Cash | 273.3 | 245.2 | 175.5 | 137.0 | 111.8 | 142.3 | 128.7 | 116.4 | 105.3 | 95.2 |
| Total Cash, percent | .0 | .0 | .0 | .0 | .0 | .0 | .0 | .0 | .0 | .0 |
| Account Receivables | 35.2 | 17.6 | 14.7 | 19.2 | 15.7 | 16.0 | 14.5 | 13.1 | 11.8 | 10.7 |
| Account Receivables, % | 12.64 | 7.6 | 9.09 | 12.08 | 8.96 | 10.07 | 10.07 | 10.07 | 10.07 | 10.07 |
| Inventories | 5.8 | 6.1 | 6.0 | .0 | .0 | 2.7 | 2.4 | 2.2 | 2.0 | 1.8 |
| Inventories, % | 2.08 | 2.65 | 3.7 | 0 | 0 | 1.69 | 1.69 | 1.69 | 1.69 | 1.69 |
| Accounts Payable | 13.2 | 10.2 | 8.7 | 6.9 | 7.9 | 7.4 | 6.7 | 6.1 | 5.5 | 5.0 |
| Accounts Payable, % | 4.74 | 4.42 | 5.36 | 4.33 | 4.51 | 4.67 | 4.67 | 4.67 | 4.67 | 4.67 |
| Capital Expenditure | -10.3 | -10.7 | -11.7 | -11.8 | -7.9 | -8.7 | -7.9 | -7.1 | -6.4 | -5.8 |
| Capital Expenditure, % | -3.69 | -4.61 | -7.23 | -7.44 | -4.48 | -5.49 | -5.49 | -5.49 | -5.49 | -5.49 |
| Tax Rate, % | -0.04833564 | -0.04833564 | -0.04833564 | -0.04833564 | -0.04833564 | -0.04833564 | -0.04833564 | -0.04833564 | -0.04833564 | -0.04833564 |
| EBITAT | 76.5 | -38.4 | -64.5 | -56.5 | -37.2 | -30.6 | -27.7 | -25.0 | -22.7 | -20.5 |
| Depreciation | ||||||||||
| Changes in Account Receivables | ||||||||||
| Changes in Inventories | ||||||||||
| Changes in Accounts Payable | ||||||||||
| Capital Expenditure | ||||||||||
| UFCF | 64.4 | -14.2 | -54.2 | -47.9 | -21.6 | -25.4 | -18.8 | -17.0 | -15.4 | -13.9 |
| WACC, % | 12.41 | 12.58 | 12.58 | 12.58 | 12.58 | 12.54 | 12.54 | 12.54 | 12.54 | 12.54 |
| PV UFCF | ||||||||||
| SUM PV UFCF | -66.6 | |||||||||
| Long Term Growth Rate, % | 2.00 | |||||||||
| Free cash flow (T + 1) | -14 | |||||||||
| Terminal Value | -134 | |||||||||
| Present Terminal Value | -74 | |||||||||
| Enterprise Value | -141 | |||||||||
| Net Debt | -101 | |||||||||
| Equity Value | -40 | |||||||||
| Diluted Shares Outstanding, MM | 90 | |||||||||
| Equity Value Per Share | -0.45 |
What You Will Get
- Real TRUE Financials: Access to historical and projected data for precise valuation.
- Customizable Inputs: Adjust WACC, tax rates, revenue growth, and capital expenditures as needed.
- Dynamic Calculations: Intrinsic value and NPV are automatically computed.
- Scenario Analysis: Evaluate various scenarios to assess TrueCar’s future performance.
- User-Friendly Design: Designed for professionals but easy for newcomers to navigate.
Key Features
- Accurate TrueCar Financials: Gain access to reliable pre-loaded historical data and future forecasts.
- Adjustable Forecast Variables: Modify yellow-highlighted cells such as WACC, growth rates, and profit margins.
- Real-Time Calculations: Automatic updates for DCF, Net Present Value (NPV), and cash flow assessments.
- Interactive Dashboard: User-friendly charts and summaries to easily visualize your valuation findings.
- Designed for All Skill Levels: An intuitive layout tailored for investors, CFOs, and consultants alike.
How It Works
- Step 1: Download the prebuilt Excel template featuring TrueCar, Inc. (TRUE) data.
- Step 2: Review the pre-filled sheets to familiarize yourself with the essential metrics.
- Step 3: Modify the forecasts and assumptions in the editable yellow cells (WACC, growth, margins).
- Step 4: Instantly see the recalculated results, including TrueCar, Inc. (TRUE)'s intrinsic value.
- Step 5: Use the outputs to make informed investment decisions or create reports.
Why Choose This TrueCar Calculator?
- Accuracy: Utilizes real TrueCar financial data for precise calculations.
- Flexibility: Allows users to easily adjust and experiment with various inputs.
- Time-Saving: Eliminates the need to create a financial model from the ground up.
- Professional-Grade: Crafted with the expertise and standards expected at the CFO level.
- User-Friendly: Intuitive interface suitable for users with varying levels of financial knowledge.
Who Should Use TrueCar, Inc. (TRUE)?
- Car Buyers: Gain confidence in your purchasing decisions with transparent pricing information.
- Automotive Analysts: Streamline your research with comprehensive market insights and data.
- Dealerships: Utilize the platform to enhance customer engagement and increase sales.
- Automotive Enthusiasts: Explore the latest trends and developments in the automotive market.
- Educators and Students: Leverage real-world data for learning about the automotive industry and market dynamics.
What the Template Contains
- Historical Data: Includes TrueCar's past financials and baseline forecasts.
- DCF and Levered DCF Models: Detailed templates to calculate TrueCar's intrinsic value.
- WACC Sheet: Pre-built calculations for Weighted Average Cost of Capital.
- Editable Inputs: Modify key drivers like growth rates, EBITDA %, and CAPEX assumptions.
- Quarterly and Annual Statements: A complete breakdown of TrueCar's financials.
- Interactive Dashboard: Visualize valuation results and projections dynamically.
Disclaimer
All information, articles, and product details provided on this website are for general informational and educational purposes only. We do not claim any ownership over, nor do we intend to infringe upon, any trademarks, copyrights, logos, brand names, or other intellectual property mentioned or depicted on this site. Such intellectual property remains the property of its respective owners, and any references here are made solely for identification or informational purposes, without implying any affiliation, endorsement, or partnership.
We make no representations or warranties, express or implied, regarding the accuracy, completeness, or suitability of any content or products presented. Nothing on this website should be construed as legal, tax, investment, financial, medical, or other professional advice. In addition, no part of this site—including articles or product references—constitutes a solicitation, recommendation, endorsement, advertisement, or offer to buy or sell any securities, franchises, or other financial instruments, particularly in jurisdictions where such activity would be unlawful.
All content is of a general nature and may not address the specific circumstances of any individual or entity. It is not a substitute for professional advice or services. Any actions you take based on the information provided here are strictly at your own risk. You accept full responsibility for any decisions or outcomes arising from your use of this website and agree to release us from any liability in connection with your use of, or reliance upon, the content or products found herein.