
|
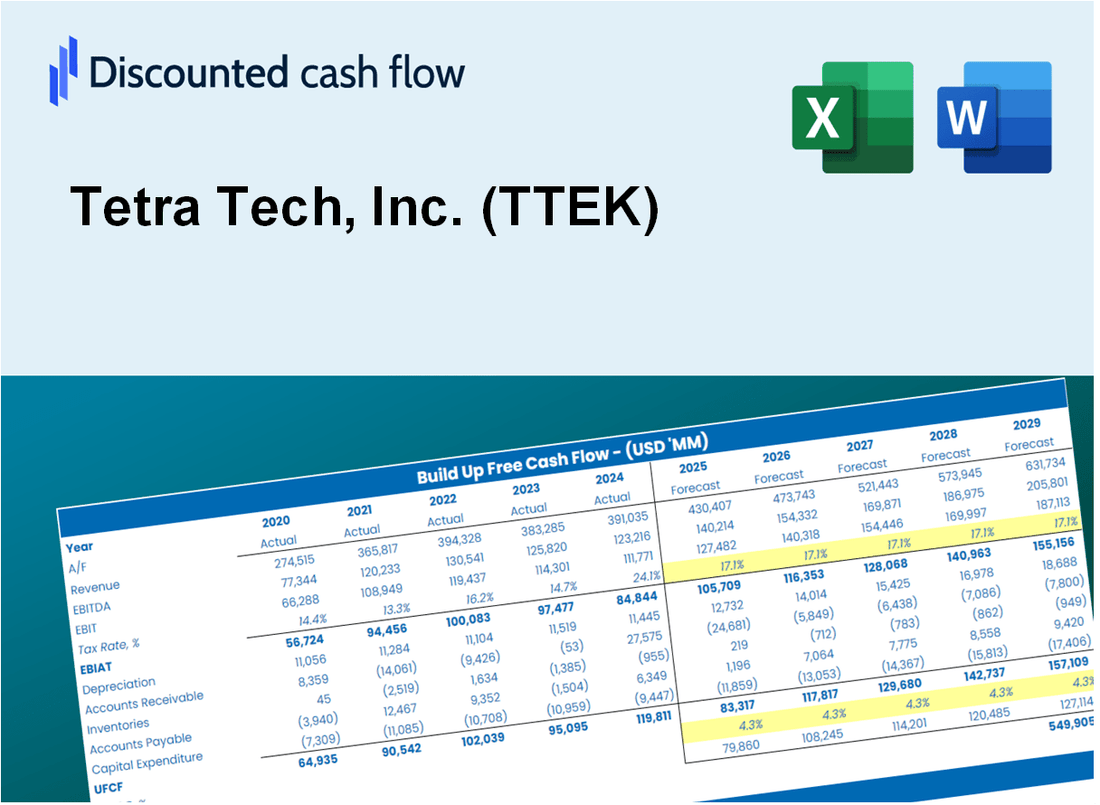
Tetra Tech, Inc. (TTEK) DCF -Bewertung |
Fully Editable: Tailor To Your Needs In Excel Or Sheets
Professional Design: Trusted, Industry-Standard Templates
Investor-Approved Valuation Models
MAC/PC Compatible, Fully Unlocked
No Expertise Is Needed; Easy To Follow
Tetra Tech, Inc. (TTEK) Bundle
Entdecken Sie den wahren Wert von Tetra Tech, Inc. mit unserem DCF-Taschenrechner von professionellem Grade! Passen Sie die wichtigsten Annahmen an, erkunden Sie verschiedene Szenarien und untersuchen, wie sich Änderungen auf die Bewertung von Tetra Tech, Inc. auswirken - alles innerhalb einer einzigen Excel -Vorlage.
What You Will Get
- Comprehensive TTEK Financials: Access to historical data and projections for precise valuation.
- Customizable Parameters: Adjust WACC, tax rates, revenue growth, and capital expenditures to fit your analysis.
- Instant Calculations: Intrinsic value and NPV are computed in real-time.
- Scenario Testing: Evaluate various scenarios to assess Tetra Tech's future performance.
- User-Friendly Interface: Designed for experts while remaining approachable for newcomers.
Key Features
- 🔍 Real-Life TTEK Financials: Pre-filled historical and projected data for Tetra Tech, Inc. (TTEK).
- ✏️ Fully Customizable Inputs: Adjust all critical parameters (yellow cells) like WACC, growth %, and tax rates.
- 📊 Professional DCF Valuation: Built-in formulas calculate Tetra Tech’s intrinsic value using the Discounted Cash Flow method.
- ⚡ Instant Results: Visualize Tetra Tech’s valuation instantly after making changes.
- Scenario Analysis: Test and compare outcomes for various financial assumptions side-by-side.
How It Works
- Step 1: Download the Excel file.
- Step 2: Review Tetra Tech’s pre-filled financial data and forecasts.
- Step 3: Modify key inputs such as revenue growth, WACC, and tax rates (highlighted cells).
- Step 4: Observe the DCF model update in real-time as you adjust your assumptions.
- Step 5: Analyze the outputs and leverage the results for your investment decisions.
Why Choose This Calculator for Tetra Tech, Inc. (TTEK)?
- Accurate Data: Utilize real Tetra Tech financials for dependable valuation outcomes.
- Customizable: Tailor essential parameters such as growth rates, WACC, and tax rates to align with your forecasts.
- Time-Saving: Pre-configured calculations save you from starting from the ground up.
- Professional-Grade Tool: Crafted for investors, analysts, and consultants in the field.
- User-Friendly: Designed with an intuitive interface and clear instructions for ease of use by everyone.
Who Should Use This Product?
- Investors: Assess Tetra Tech’s valuation before making investment decisions.
- CFOs and Financial Analysts: Enhance valuation methodologies and evaluate financial forecasts.
- Startup Founders: Understand the valuation approaches of established firms like Tetra Tech.
- Consultants: Provide detailed valuation analyses and reports for clients.
- Students and Educators: Utilize real-world examples to learn and teach valuation strategies.
What the Template Contains
- Comprehensive DCF Model: Editable template with detailed valuation calculations tailored for Tetra Tech, Inc. (TTEK).
- Real-World Data: Tetra Tech’s historical and projected financials preloaded for analysis.
- Customizable Parameters: Adjust WACC, growth rates, and tax assumptions to test various scenarios.
- Financial Statements: Complete annual and quarterly breakdowns for deeper insights into Tetra Tech’s performance.
- Key Ratios: Built-in analysis for profitability, efficiency, and leverage specific to Tetra Tech, Inc. (TTEK).
- Dashboard with Visual Outputs: Charts and tables providing clear, actionable results for informed decision-making.
Disclaimer
All information, articles, and product details provided on this website are for general informational and educational purposes only. We do not claim any ownership over, nor do we intend to infringe upon, any trademarks, copyrights, logos, brand names, or other intellectual property mentioned or depicted on this site. Such intellectual property remains the property of its respective owners, and any references here are made solely for identification or informational purposes, without implying any affiliation, endorsement, or partnership.
We make no representations or warranties, express or implied, regarding the accuracy, completeness, or suitability of any content or products presented. Nothing on this website should be construed as legal, tax, investment, financial, medical, or other professional advice. In addition, no part of this site—including articles or product references—constitutes a solicitation, recommendation, endorsement, advertisement, or offer to buy or sell any securities, franchises, or other financial instruments, particularly in jurisdictions where such activity would be unlawful.
All content is of a general nature and may not address the specific circumstances of any individual or entity. It is not a substitute for professional advice or services. Any actions you take based on the information provided here are strictly at your own risk. You accept full responsibility for any decisions or outcomes arising from your use of this website and agree to release us from any liability in connection with your use of, or reliance upon, the content or products found herein.