
|
TTM Technologies, Inc. (TTMI) DCF -Bewertung |
Fully Editable: Tailor To Your Needs In Excel Or Sheets
Professional Design: Trusted, Industry-Standard Templates
Investor-Approved Valuation Models
MAC/PC Compatible, Fully Unlocked
No Expertise Is Needed; Easy To Follow
TTM Technologies, Inc. (TTMI) Bundle
Unser (TTMI) DCF-Taschenrechner entwickelt für Genauigkeit und ermöglicht es Ihnen, die Bewertung von TTM Technologies, Inc. unter Verwendung realer Finanzdaten zu bewerten und vollständige Flexibilität zu bieten, um alle wesentlichen Parameter für erweiterte Projektionen zu ändern.
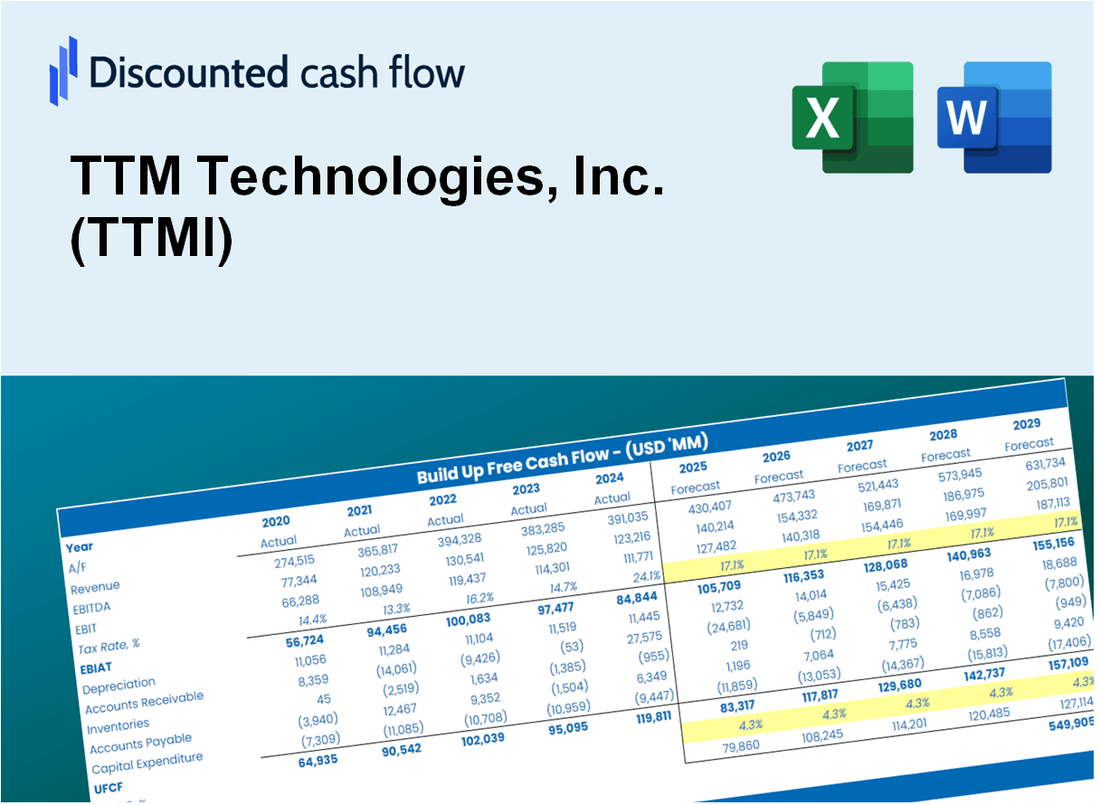
Discounted Cash Flow (DCF) - (USD MM)
| Year | AY1 2020 |
AY2 2021 |
AY3 2022 |
AY4 2023 |
AY5 2024 |
FY1 2025 |
FY2 2026 |
FY3 2027 |
FY4 2028 |
FY5 2029 |
|---|---|---|---|---|---|---|---|---|---|---|
| Revenue | 2,105.3 | 2,248.7 | 2,495.0 | 2,232.6 | 2,442.8 | 2,544.5 | 2,650.5 | 2,760.9 | 2,875.8 | 2,995.6 |
| Revenue Growth, % | 0 | 6.81 | 10.95 | -10.52 | 9.41 | 4.16 | 4.16 | 4.16 | 4.16 | 4.16 |
| EBITDA | 161.9 | 231.6 | 358.2 | 205.9 | 277.4 | 269.3 | 280.5 | 292.2 | 304.4 | 317.1 |
| EBITDA, % | 7.69 | 10.3 | 14.36 | 9.22 | 11.36 | 10.58 | 10.58 | 10.58 | 10.58 | 10.58 |
| Depreciation | 143.9 | 127.3 | 133.9 | 160.7 | 150.1 | 158.8 | 165.5 | 172.3 | 179.5 | 187.0 |
| Depreciation, % | 6.84 | 5.66 | 5.37 | 7.2 | 6.15 | 6.24 | 6.24 | 6.24 | 6.24 | 6.24 |
| EBIT | 17.9 | 104.3 | 224.3 | 45.2 | 127.3 | 110.5 | 115.1 | 119.9 | 124.9 | 130.1 |
| EBIT, % | 0.85198 | 4.64 | 8.99 | 2.02 | 5.21 | 4.34 | 4.34 | 4.34 | 4.34 | 4.34 |
| Total Cash | 451.6 | 537.7 | 402.7 | 450.2 | 503.9 | 520.6 | 542.3 | 564.8 | 588.4 | 612.9 |
| Total Cash, percent | .0 | .0 | .0 | .0 | .0 | .0 | .0 | .0 | .0 | .0 |
| Account Receivables | 654.4 | 711.2 | 878.3 | 712.3 | 830.0 | 833.5 | 868.3 | 904.4 | 942.1 | 981.3 |
| Account Receivables, % | 31.08 | 31.63 | 35.2 | 31.91 | 33.98 | 32.76 | 32.76 | 32.76 | 32.76 | 32.76 |
| Inventories | 115.7 | 127.6 | 170.6 | 213.1 | 225.0 | 187.1 | 194.9 | 203.0 | 211.4 | 220.2 |
| Inventories, % | 5.49 | 5.67 | 6.84 | 9.54 | 9.21 | 7.35 | 7.35 | 7.35 | 7.35 | 7.35 |
| Accounts Payable | 327.1 | 361.5 | 361.8 | 334.6 | 406.2 | 395.6 | 412.0 | 429.2 | 447.1 | 465.7 |
| Accounts Payable, % | 15.54 | 16.07 | 14.5 | 14.99 | 16.63 | 15.55 | 15.55 | 15.55 | 15.55 | 15.55 |
| Capital Expenditure | -103.3 | -82.0 | -102.9 | -160.2 | -185.7 | -139.7 | -145.5 | -151.6 | -157.9 | -164.5 |
| Capital Expenditure, % | -4.91 | -3.64 | -4.12 | -7.18 | -7.6 | -5.49 | -5.49 | -5.49 | -5.49 | -5.49 |
| Tax Rate, % | 32.94 | 32.94 | 32.94 | 32.94 | 32.94 | 32.94 | 32.94 | 32.94 | 32.94 | 32.94 |
| EBITAT | -68.8 | 81.0 | 116.0 | -2,847.3 | 85.3 | 43.4 | 45.2 | 47.1 | 49.1 | 51.1 |
| Depreciation | ||||||||||
| Changes in Account Receivables | ||||||||||
| Changes in Inventories | ||||||||||
| Changes in Accounts Payable | ||||||||||
| Capital Expenditure | ||||||||||
| UFCF | -471.1 | 91.9 | -62.7 | -2,750.5 | -8.2 | 86.2 | 39.1 | 40.7 | 42.4 | 44.2 |
| WACC, % | 9.93 | 10.4 | 10.24 | 9.93 | 10.33 | 10.17 | 10.17 | 10.17 | 10.17 | 10.17 |
| PV UFCF | ||||||||||
| SUM PV UFCF | 197.0 | |||||||||
| Long Term Growth Rate, % | 2.00 | |||||||||
| Free cash flow (T + 1) | 45 | |||||||||
| Terminal Value | 552 | |||||||||
| Present Terminal Value | 340 | |||||||||
| Enterprise Value | 537 | |||||||||
| Net Debt | 511 | |||||||||
| Equity Value | 26 | |||||||||
| Diluted Shares Outstanding, MM | 104 | |||||||||
| Equity Value Per Share | 0.25 |
What You Will Get
- Pre-Filled Financial Model: TTM Technologies’ actual data enables precise DCF valuation.
- Full Forecast Control: Adjust revenue growth, margins, WACC, and other key drivers for [TTMI].
- Instant Calculations: Automatic updates ensure you see results as you make changes to your model.
- Investor-Ready Template: A refined Excel file designed for professional-grade valuation of [TTMI].
- Customizable and Reusable: Tailored for flexibility, allowing repeated use for detailed forecasts on [TTMI].
Key Features
- Customizable Forecast Inputs: Adjust essential metrics such as revenue growth, EBITDA %, and capital expenditures specific to TTM Technologies, Inc. (TTMI).
- Instant DCF Valuation: Automatically computes intrinsic value, NPV, and additional financial metrics in real-time.
- High-Precision Accuracy: Leverages TTM Technologies' actual financial data for credible valuation results.
- Effortless Scenario Analysis: Easily evaluate various assumptions and analyze results side by side.
- Efficiency Booster: Avoid the hassle of constructing intricate valuation models from the ground up.
How It Works
- Download: Obtain the pre-formatted Excel file containing TTM Technologies, Inc. (TTMI) financial data.
- Customize: Modify forecasts such as revenue growth, EBITDA %, and WACC to fit your analysis.
- Update Automatically: Watch as the intrinsic value and NPV calculations refresh in real-time.
- Test Scenarios: Develop various projections and instantly compare their outcomes.
- Make Decisions: Leverage the valuation results to inform your investment choices.
Why Choose This Calculator for TTM Technologies, Inc. (TTMI)?
- Designed for Experts: A sophisticated tool utilized by industry analysts, CFOs, and consultants.
- Accurate Data: TTM Technologies' historical and projected financials are preloaded for precision.
- Flexible Scenario Analysis: Effortlessly simulate various forecasts and assumptions.
- Concise Outputs: Instantly calculates intrinsic value, NPV, and essential metrics.
- User-Friendly: Comprehensive step-by-step instructions to assist you throughout the process.
Who Should Use This Product?
- Investors: Assess TTM Technologies' valuation prior to making stock transactions.
- CFOs and Financial Analysts: Enhance valuation workflows and evaluate financial forecasts.
- Startup Founders: Understand the valuation methods applied to significant public firms like TTM Technologies.
- Consultants: Create comprehensive valuation reports for your clients.
- Students and Educators: Utilize actual market data to practice and instruct on valuation methodologies.
What the Template Contains
- Comprehensive DCF Model: Editable template featuring detailed valuation calculations for TTM Technologies, Inc. (TTMI).
- Real-World Data: TTM Technologies' historical and projected financials preloaded for in-depth analysis.
- Customizable Parameters: Modify WACC, growth rates, and tax assumptions to explore various scenarios.
- Financial Statements: Complete annual and quarterly breakdowns to gain deeper insights into the company's performance.
- Key Ratios: Integrated analysis for profitability, efficiency, and leverage metrics.
- Dashboard with Visual Outputs: Charts and tables that provide clear, actionable results for stakeholders.
Disclaimer
All information, articles, and product details provided on this website are for general informational and educational purposes only. We do not claim any ownership over, nor do we intend to infringe upon, any trademarks, copyrights, logos, brand names, or other intellectual property mentioned or depicted on this site. Such intellectual property remains the property of its respective owners, and any references here are made solely for identification or informational purposes, without implying any affiliation, endorsement, or partnership.
We make no representations or warranties, express or implied, regarding the accuracy, completeness, or suitability of any content or products presented. Nothing on this website should be construed as legal, tax, investment, financial, medical, or other professional advice. In addition, no part of this site—including articles or product references—constitutes a solicitation, recommendation, endorsement, advertisement, or offer to buy or sell any securities, franchises, or other financial instruments, particularly in jurisdictions where such activity would be unlawful.
All content is of a general nature and may not address the specific circumstances of any individual or entity. It is not a substitute for professional advice or services. Any actions you take based on the information provided here are strictly at your own risk. You accept full responsibility for any decisions or outcomes arising from your use of this website and agree to release us from any liability in connection with your use of, or reliance upon, the content or products found herein.