
|
Tata Teleservices Limited (TTML.NS) DCF -Bewertung |
Fully Editable: Tailor To Your Needs In Excel Or Sheets
Professional Design: Trusted, Industry-Standard Templates
Investor-Approved Valuation Models
MAC/PC Compatible, Fully Unlocked
No Expertise Is Needed; Easy To Follow
Tata Teleservices (Maharashtra) Limited (TTML.NS) Bundle
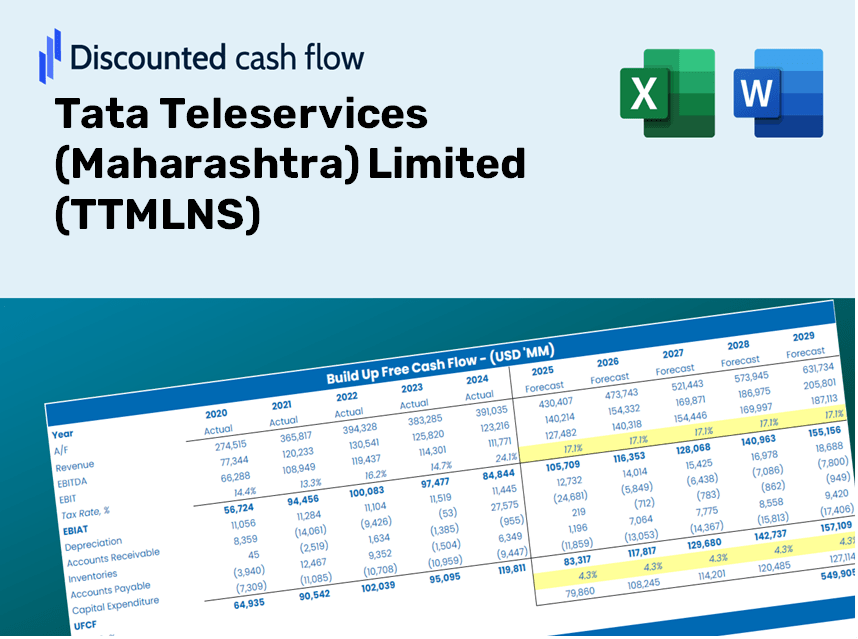
Gewinnen Sie einen Einblick in Ihre Tata Teleservices (Maharashtra) Limited (TTMLNS) Bewertungsanalyse mit unserem ausgefeilten DCF -Taschenrechner! Diese Excel -Vorlage wird mit realen (TTMLNs) Daten vorinstalliert, sodass Sie Prognosen und Annahmen anpassen können, um den inneren Wert von Tata Teleservices (Maharashtra) begrenzt genau zu bestimmen.
Discounted Cash Flow (DCF) - (USD MM)
| Year | AY1 2021 |
AY2 2022 |
AY3 2023 |
AY4 2024 |
AY5 2025 |
FY1 2026 |
FY2 2027 |
FY3 2028 |
FY4 2029 |
FY5 2030 |
|---|---|---|---|---|---|---|---|---|---|---|
| Revenue | 10,477.9 | 10,938.0 | 11,061.7 | 11,916.5 | 13,080.4 | 13,833.1 | 14,629.1 | 15,470.8 | 16,361.1 | 17,302.5 |
| Revenue Growth, % | 0 | 4.39 | 1.13 | 7.73 | 9.77 | 5.75 | 5.75 | 5.75 | 5.75 | 5.75 |
| EBITDA | 4,444.5 | 4,311.4 | 4,560.6 | 4,847.1 | 5,175.1 | 5,624.6 | 5,948.2 | 6,290.5 | 6,652.5 | 7,035.3 |
| EBITDA, % | 42.42 | 39.42 | 41.23 | 40.68 | 39.56 | 40.66 | 40.66 | 40.66 | 40.66 | 40.66 |
| Depreciation | 1,187.8 | 1,166.1 | 1,066.5 | 1,030.7 | 1,096.2 | 1,346.5 | 1,423.9 | 1,505.9 | 1,592.5 | 1,684.2 |
| Depreciation, % | 11.34 | 10.66 | 9.64 | 8.65 | 8.38 | 9.73 | 9.73 | 9.73 | 9.73 | 9.73 |
| EBIT | 3,256.7 | 3,145.3 | 3,494.1 | 3,816.4 | 4,078.9 | 4,278.1 | 4,524.3 | 4,784.6 | 5,060.0 | 5,351.1 |
| EBIT, % | 31.08 | 28.76 | 31.59 | 32.03 | 31.18 | 30.93 | 30.93 | 30.93 | 30.93 | 30.93 |
| Total Cash | 1,135.2 | 1,175.2 | 806.7 | 668.4 | 1,003.5 | 1,166.2 | 1,233.3 | 1,304.3 | 1,379.3 | 1,458.7 |
| Total Cash, percent | .0 | .0 | .0 | .0 | .0 | .0 | .0 | .0 | .0 | .0 |
| Account Receivables | 1,394.9 | 1,213.1 | 1,176.2 | 1,629.3 | 1,585.9 | 1,683.0 | 1,779.9 | 1,882.3 | 1,990.6 | 2,105.1 |
| Account Receivables, % | 13.31 | 11.09 | 10.63 | 13.67 | 12.12 | 12.17 | 12.17 | 12.17 | 12.17 | 12.17 |
| Inventories | .0 | .0 | .0 | .0 | .0 | .0 | .0 | .0 | .0 | .0 |
| Inventories, % | 0 | 0 | 0 | 0 | 0 | 0 | 0 | 0 | 0 | 0 |
| Accounts Payable | 2,587.0 | 2,242.1 | 2,090.9 | 2,671.4 | 2,105.8 | 2,838.7 | 3,002.1 | 3,174.8 | 3,357.5 | 3,550.7 |
| Accounts Payable, % | 24.69 | 20.5 | 18.9 | 22.42 | 16.1 | 20.52 | 20.52 | 20.52 | 20.52 | 20.52 |
| Capital Expenditure | -1,137.7 | -1,076.2 | -1,110.3 | -1,087.6 | -991.2 | -1,312.5 | -1,388.0 | -1,467.8 | -1,552.3 | -1,641.6 |
| Capital Expenditure, % | -10.86 | -9.84 | -10.04 | -9.13 | -7.58 | -9.49 | -9.49 | -9.49 | -9.49 | -9.49 |
| Tax Rate, % | 0 | 0 | 0 | 0 | 0 | 0 | 0 | 0 | 0 | 0 |
| EBITAT | 3,256.7 | 3,145.3 | 3,494.1 | 3,816.4 | 4,078.9 | 4,278.1 | 4,524.3 | 4,784.6 | 5,060.0 | 5,351.1 |
| Depreciation | ||||||||||
| Changes in Account Receivables | ||||||||||
| Changes in Inventories | ||||||||||
| Changes in Accounts Payable | ||||||||||
| Capital Expenditure | ||||||||||
| UFCF | 4,498.9 | 3,072.1 | 3,336.0 | 3,886.9 | 3,661.7 | 4,948.0 | 4,626.8 | 4,893.0 | 5,174.6 | 5,472.3 |
| WACC, % | 7.44 | 7.44 | 7.44 | 7.44 | 7.44 | 7.44 | 7.44 | 7.44 | 7.44 | 7.44 |
| PV UFCF | ||||||||||
| SUM PV UFCF | 20,263.0 | |||||||||
| Long Term Growth Rate, % | 2.00 | |||||||||
| Free cash flow (T + 1) | 5,582 | |||||||||
| Terminal Value | 102,553 | |||||||||
| Present Terminal Value | 71,624 | |||||||||
| Enterprise Value | 91,887 | |||||||||
| Net Debt | 203,734 | |||||||||
| Equity Value | -111,847 | |||||||||
| Diluted Shares Outstanding, MM | 1,955 | |||||||||
| Equity Value Per Share | -57.21 |
What You Will Receive
- Genuine Tata Data: Preloaded financials – encompassing revenue to EBIT – based on actual and projected figures.
- Comprehensive Customization: Modify all essential parameters (yellow cells) such as WACC, growth %, and tax rates.
- Immediate Valuation Adjustments: Automatic recalculations to assess the effects of changes on Tata Teleservices' fair value.
- Flexible Excel Template: Designed for quick edits, scenario testing, and in-depth projections.
- Efficient and Precise: Avoid the hassle of building models from scratch while ensuring accuracy and adaptability.
Highlighted Features
- Comprehensive DCF Calculator: Features both unlevered and levered DCF valuation models tailored for Tata Teleservices (Maharashtra) Limited (TTMLNS).
- WACC Calculator: A readily available Weighted Average Cost of Capital sheet with adjustable inputs specific to TTMLNS.
- Customizable Forecast Assumptions: Easily update growth rates, capital expenditures, and discount rates pertinent to Tata Teleservices.
- Integrated Financial Ratios: Evaluate profitability, leverage, and efficiency ratios for Tata Teleservices (Maharashtra) Limited (TTMLNS).
- Interactive Dashboard and Charts: Visual representations effectively summarize vital valuation metrics for straightforward analysis.
How It Operates
- 1. Access the Template: Download and open the Excel file containing Tata Teleservices (Maharashtra) Limited (TTMLNS) data.
- 2. Modify Assumptions: Adjust critical inputs such as growth rates, WACC, and capital expenditures.
- 3. Instant Results: The DCF model automatically calculates the intrinsic value and NPV based on your inputs.
- 4. Test Various Scenarios: Analyze different valuation outcomes by comparing multiple forecasts.
- 5. Present with Assurance: Deliver professional valuation insights to guide your strategic decisions.
Why Opt for This Calculator for Tata Teleservices (Maharashtra) Limited (TTMLNS)?
- All-in-One Solution: Combines DCF, WACC, and financial ratio analyses into a single tool.
- Flexible Inputs: Modify the yellow-highlighted fields to explore different scenarios.
- In-Depth Analysis: Automatically computes the intrinsic value and Net Present Value for TTMLNS.
- Ready-to-Use Data: Includes historical and forecast data for precise initial assessments.
- High-Quality Standards: Perfect for financial analysts, investors, and business consultants focused on TTMLNS.
Who Can Benefit from This Product?
- Telecommunications Students: Explore industry-specific valuation methods and apply them to real-world data.
- Researchers: Integrate advanced models into your academic studies or projects related to the telecom sector.
- Investors: Validate your investment strategies and assess valuation results for Tata Teleservices (Maharashtra) Limited (TTMLNS).
- Market Analysts: Enhance your analysis process with an easy-to-use, customizable DCF model tailored for the telecom industry.
- Entrepreneurs: Discover how large telecom firms like Tata Teleservices are evaluated in the market.
What the Template Includes
- Preloaded TTMLNS Data: Historical and forecasted financial metrics, including revenue, EBIT, and capital expenditures.
- DCF and WACC Models: Professional-grade spreadsheets for assessing intrinsic value and Weighted Average Cost of Capital.
- Editable Inputs: Cells highlighted in yellow for modifying revenue growth, tax rates, and discount rates.
- Financial Statements: Detailed annual and quarterly financial reports for in-depth analysis.
- Key Ratios: Profitability, leverage, and efficiency ratios for performance evaluation.
- Dashboard and Charts: Visual representations of valuation results and underlying assumptions.
Disclaimer
All information, articles, and product details provided on this website are for general informational and educational purposes only. We do not claim any ownership over, nor do we intend to infringe upon, any trademarks, copyrights, logos, brand names, or other intellectual property mentioned or depicted on this site. Such intellectual property remains the property of its respective owners, and any references here are made solely for identification or informational purposes, without implying any affiliation, endorsement, or partnership.
We make no representations or warranties, express or implied, regarding the accuracy, completeness, or suitability of any content or products presented. Nothing on this website should be construed as legal, tax, investment, financial, medical, or other professional advice. In addition, no part of this site—including articles or product references—constitutes a solicitation, recommendation, endorsement, advertisement, or offer to buy or sell any securities, franchises, or other financial instruments, particularly in jurisdictions where such activity would be unlawful.
All content is of a general nature and may not address the specific circumstances of any individual or entity. It is not a substitute for professional advice or services. Any actions you take based on the information provided here are strictly at your own risk. You accept full responsibility for any decisions or outcomes arising from your use of this website and agree to release us from any liability in connection with your use of, or reliance upon, the content or products found herein.