
|
Titan Pharmaceuticals, Inc. (TTNP) DCF -Bewertung |
Fully Editable: Tailor To Your Needs In Excel Or Sheets
Professional Design: Trusted, Industry-Standard Templates
Investor-Approved Valuation Models
MAC/PC Compatible, Fully Unlocked
No Expertise Is Needed; Easy To Follow
Titan Pharmaceuticals, Inc. (TTNP) Bundle
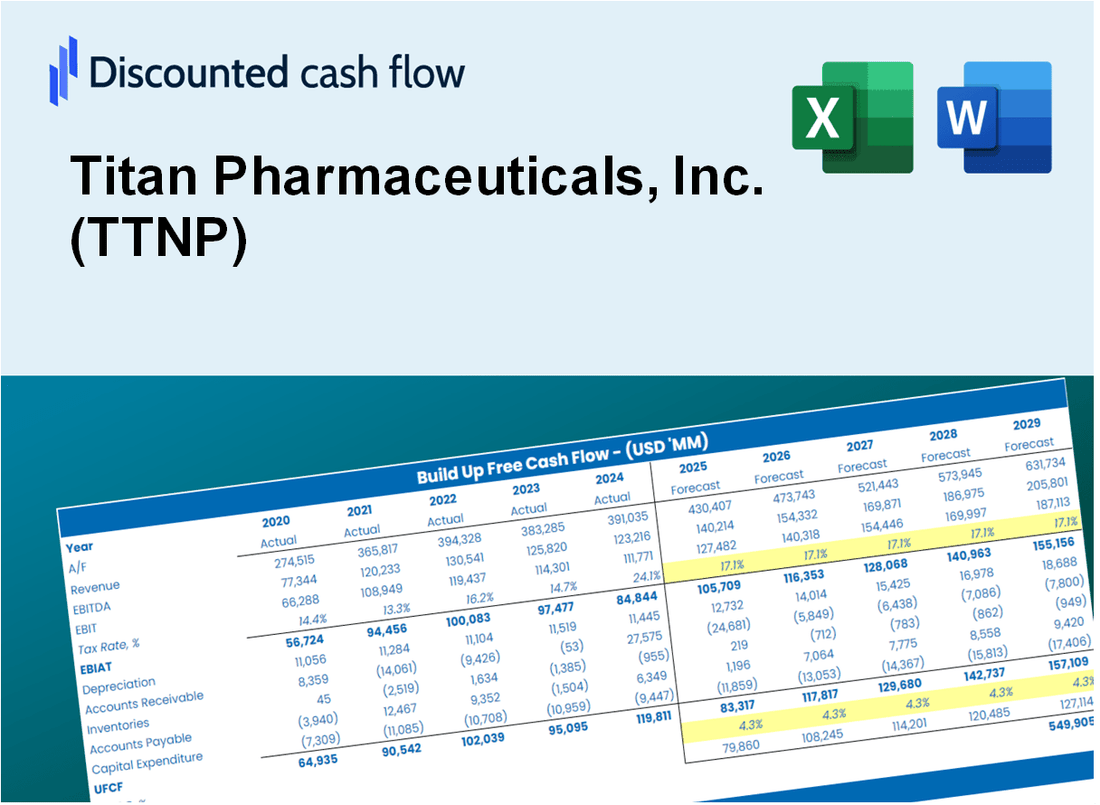
Vereinfachen Sie die Bewertung von Titan Pharmaceuticals, Inc. (TTNP) mit diesem anpassbaren DCF -Taschenrechner! Mit Real Titan Pharmaceuticals, Inc. (TTNP) Finanzdaten und einstellbaren Prognoseeingaben können Sie Szenarien testen und Titan Pharmaceuticals, Inc. (TTNP) in Minuten aufdecken.
What You Will Get
- Editable Excel Template: A fully customizable Excel-based DCF Calculator featuring pre-filled real TTNP financials.
- Real-World Data: Historical data and forward-looking estimates (as indicated in the yellow cells).
- Forecast Flexibility: Adjust forecast assumptions such as revenue growth, EBITDA %, and WACC.
- Automatic Calculations: Instantly observe the effects of your inputs on Titan Pharmaceuticals’ valuation.
- Professional Tool: Designed for investors, CFOs, consultants, and financial analysts.
- User-Friendly Design: Organized for clarity and ease of use, complete with step-by-step instructions.
Key Features
- Accurate Titan Financials: Gain access to reliable pre-loaded historical data and future forecasts.
- Adjustable Forecast Parameters: Modify highlighted cells for key metrics like WACC, growth rates, and profit margins.
- Real-Time Calculations: Automatic adjustments to DCF, Net Present Value (NPV), and cash flow evaluations.
- Interactive Dashboard: User-friendly charts and summaries to clearly present your valuation outcomes.
- Designed for All Users: An intuitive layout suitable for investors, CFOs, and consultants alike.
How It Works
- 1. Access the Template: Download and open the Excel file featuring Titan Pharmaceuticals, Inc. (TTNP) preloaded data.
- 2. Adjust Assumptions: Modify key parameters such as growth rates, WACC, and capital expenditures.
- 3. View Results Instantly: The DCF model automatically calculates intrinsic value and NPV based on your inputs.
- 4. Explore Scenarios: Evaluate various forecasts to analyze different valuation scenarios.
- 5. Present with Assurance: Deliver professional valuation insights to enhance your decision-making process.
Why Choose This Calculator for Titan Pharmaceuticals, Inc. (TTNP)?
- Accuracy: Utilizes real Titan Pharmaceuticals financials to ensure precise data.
- Flexibility: Tailored for users to experiment with and adjust inputs as needed.
- Time-Saving: Eliminate the complexities of constructing a DCF model from the ground up.
- Professional-Grade: Crafted with the precision and usability expected by CFOs.
- User-Friendly: Intuitive design makes it accessible for users without extensive financial modeling skills.
Who Should Use This Product?
- Professional Investors: Develop comprehensive and accurate valuation models for investment analysis in Titan Pharmaceuticals, Inc. (TTNP).
- Corporate Finance Teams: Evaluate valuation scenarios to inform strategic decisions within their organizations.
- Consultants and Advisors: Deliver precise valuation insights for clients interested in Titan Pharmaceuticals, Inc. (TTNP).
- Students and Educators: Utilize real-world data to enhance learning and practice in financial modeling.
- Healthcare Enthusiasts: Gain insights into how biopharmaceutical companies like Titan Pharmaceuticals, Inc. (TTNP) are valued in the market.
What the Template Contains
- Comprehensive DCF Model: Editable template featuring detailed valuation calculations for Titan Pharmaceuticals, Inc. (TTNP).
- Real-World Data: Titan's historical and projected financials preloaded for in-depth analysis.
- Customizable Parameters: Modify WACC, growth rates, and tax assumptions to explore various scenarios.
- Financial Statements: Complete annual and quarterly breakdowns for enhanced insights into Titan's performance.
- Key Ratios: Integrated analysis for profitability, efficiency, and leverage specific to Titan Pharmaceuticals, Inc. (TTNP).
- Dashboard with Visual Outputs: Charts and tables designed for clear and actionable results related to Titan Pharmaceuticals, Inc. (TTNP).
Disclaimer
All information, articles, and product details provided on this website are for general informational and educational purposes only. We do not claim any ownership over, nor do we intend to infringe upon, any trademarks, copyrights, logos, brand names, or other intellectual property mentioned or depicted on this site. Such intellectual property remains the property of its respective owners, and any references here are made solely for identification or informational purposes, without implying any affiliation, endorsement, or partnership.
We make no representations or warranties, express or implied, regarding the accuracy, completeness, or suitability of any content or products presented. Nothing on this website should be construed as legal, tax, investment, financial, medical, or other professional advice. In addition, no part of this site—including articles or product references—constitutes a solicitation, recommendation, endorsement, advertisement, or offer to buy or sell any securities, franchises, or other financial instruments, particularly in jurisdictions where such activity would be unlawful.
All content is of a general nature and may not address the specific circumstances of any individual or entity. It is not a substitute for professional advice or services. Any actions you take based on the information provided here are strictly at your own risk. You accept full responsibility for any decisions or outcomes arising from your use of this website and agree to release us from any liability in connection with your use of, or reliance upon, the content or products found herein.