
|
Taylor Wimpey Plc (Tw.l) DCF -Bewertung |
Fully Editable: Tailor To Your Needs In Excel Or Sheets
Professional Design: Trusted, Industry-Standard Templates
Investor-Approved Valuation Models
MAC/PC Compatible, Fully Unlocked
No Expertise Is Needed; Easy To Follow
Taylor Wimpey plc (TW.L) Bundle
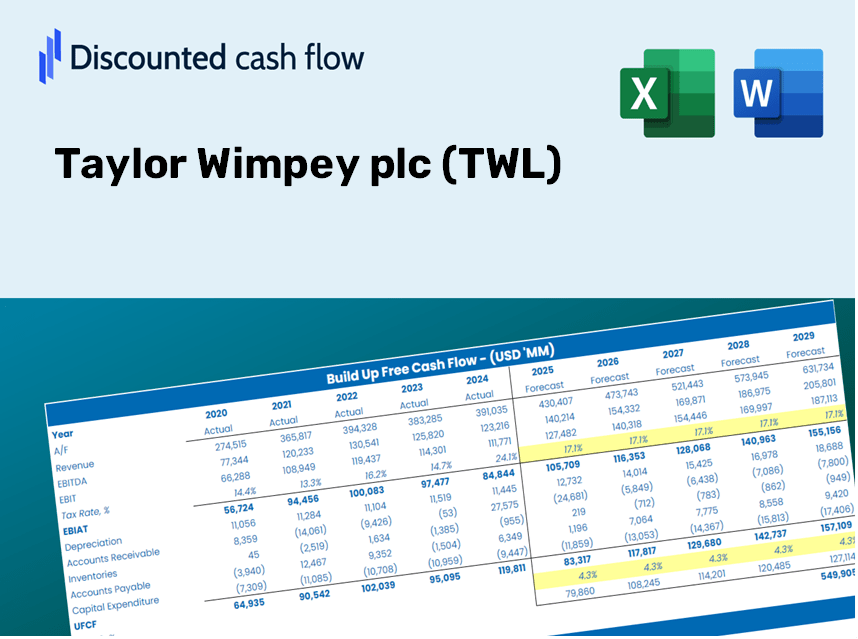
Vereinfachen Sie die Bewertung der Taylor Wimpey Plc (TWL) mit diesem anpassbaren DCF -Taschenrechner! Mit Real Taylor Wimpey PLC (TWL) -Fonds und einstellbaren Prognose -Inputs können Sie Szenarien testen und Taylor Wimpey Plc (TWL) in Minuten aufdecken.
What You Will Receive
- Customizable Excel Template: A fully adaptable Excel-based DCF Calculator featuring pre-filled real financial data for TWL (Taylor Wimpey plc).
- Real-World Insights: Access to historical data and future projections (indicated in the highlighted cells).
- Forecast Customization: Modify key assumptions such as revenue growth, EBITDA %, and WACC as needed.
- Instant Calculations: Quickly observe how your inputs affect the valuation of Taylor Wimpey plc.
- Professional Resource: Designed specifically for investors, CFOs, consultants, and financial analysts.
- User-Friendly Layout: Organized for clarity and simplicity, complete with easy-to-follow instructions.
Key Features
- Customizable Forecast Inputs: Adjust essential factors such as sales growth, profit margins, and investment expenses.
- Instant DCF Valuation: Automatically computes intrinsic value, net present value (NPV), and additional results in real-time.
- Expert-Level Precision: Incorporates Taylor Wimpey plc's (TWL) actual financial data for accurate valuation insights.
- Effortless Scenario Testing: Evaluate various assumptions and analyze different outcomes with ease.
- Efficiency Booster: Avoid the hassle of constructing intricate valuation models from the ground up.
How It Functions
- Download the Template: Gain immediate access to the Excel-based TWL DCF Calculator.
- Input Your Assumptions: Modify the yellow-highlighted cells for growth rates, WACC, margins, and other variables.
- Instant Calculations: The model promptly updates the intrinsic value of Taylor Wimpey plc.
- Test Scenarios: Experiment with various assumptions to analyze potential changes in valuation.
- Analyze and Decide: Utilize the results to inform your investment or financial assessments.
Why Opt for This Calculator?
- All-in-One Solution: Combines DCF, WACC, and financial ratio analyses for comprehensive evaluations.
- Flexible Inputs: Modify yellow-highlighted fields to explore different scenarios.
- In-Depth Analysis: Automatically calculates Taylor Wimpey's intrinsic value and Net Present Value.
- Pre-Loaded Information: Historical and projected data provide reliable starting points.
- High-Quality Standards: Perfect for financial analysts, investors, and business consultants working with Taylor Wimpey plc (TW.)
Who Can Benefit from Taylor Wimpey plc (TWL)?
- Real Estate Investors: Make informed decisions with a robust valuation tool tailored for property investments.
- Market Analysts: Streamline your analysis with an easily customizable DCF model specific to the housing sector.
- Financial Consultants: Effortlessly modify the template for client-specific presentations or detailed reports.
- Property Enthusiasts: Enhance your knowledge of real estate valuation techniques through practical examples.
- Educators and Students: Utilize this resource as a hands-on learning aid in real estate and finance courses.
Contents of the Template
- Pre-Filled Data: Contains Taylor Wimpey plc's historical financials and projections.
- Discounted Cash Flow Model: An editable DCF valuation model with automatic calculations.
- Weighted Average Cost of Capital (WACC): A dedicated sheet for WACC calculations using customized inputs.
- Key Financial Ratios: Evaluate Taylor Wimpey plc's profitability, efficiency, and financial leverage.
- Customizable Inputs: Easily modify revenue growth rates, margins, and tax rates.
- Clear Dashboard: Visual representations and tables summarizing essential valuation outputs.
Disclaimer
All information, articles, and product details provided on this website are for general informational and educational purposes only. We do not claim any ownership over, nor do we intend to infringe upon, any trademarks, copyrights, logos, brand names, or other intellectual property mentioned or depicted on this site. Such intellectual property remains the property of its respective owners, and any references here are made solely for identification or informational purposes, without implying any affiliation, endorsement, or partnership.
We make no representations or warranties, express or implied, regarding the accuracy, completeness, or suitability of any content or products presented. Nothing on this website should be construed as legal, tax, investment, financial, medical, or other professional advice. In addition, no part of this site—including articles or product references—constitutes a solicitation, recommendation, endorsement, advertisement, or offer to buy or sell any securities, franchises, or other financial instruments, particularly in jurisdictions where such activity would be unlawful.
All content is of a general nature and may not address the specific circumstances of any individual or entity. It is not a substitute for professional advice or services. Any actions you take based on the information provided here are strictly at your own risk. You accept full responsibility for any decisions or outcomes arising from your use of this website and agree to release us from any liability in connection with your use of, or reliance upon, the content or products found herein.