
|
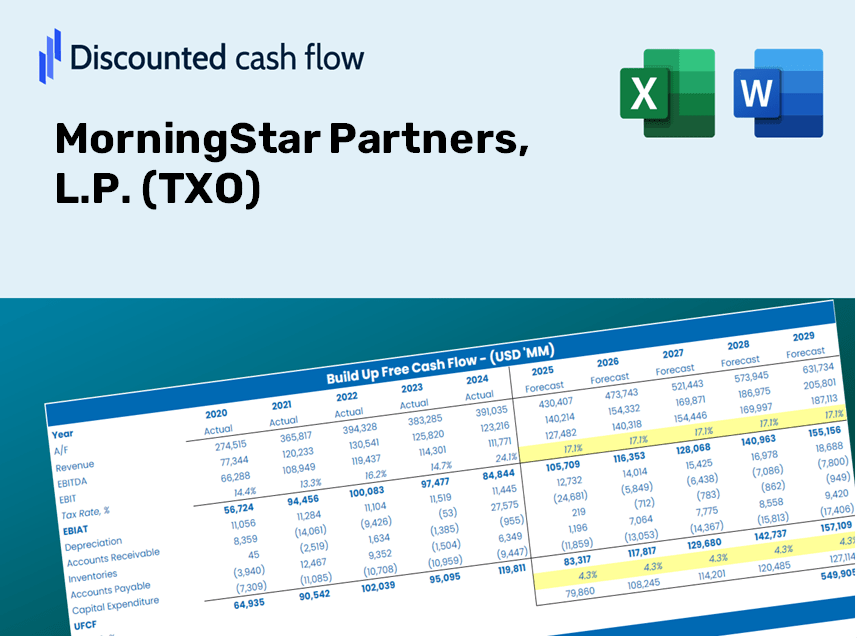
Morningstar Partners, L.P. (TXO) DCF -Bewertung |
Fully Editable: Tailor To Your Needs In Excel Or Sheets
Professional Design: Trusted, Industry-Standard Templates
Investor-Approved Valuation Models
MAC/PC Compatible, Fully Unlocked
No Expertise Is Needed; Easy To Follow
MorningStar Partners, L.P. (TXO) Bundle
Gewinnen Sie einen Einblick in Ihre Morningstar Partners, L.P. (TXO) Bewertungsanalyse mit unserem hochmodernen DCF-Taschenrechner! Mit dieser Excel -Vorlage können Sie mit realen (TXO-) Daten ausgestattet sind, und ermöglicht es Ihnen, Prognosen und Annahmen anzupassen, um den inneren Wert von Morningstar Partners, L.P.
Benefits of Choosing MorningStar Partners, L.P. (TXO)
- Comprehensive Financial Model: Leverage accurate data for thorough DCF valuation.
- Complete Forecasting Flexibility: Modify revenue growth, profit margins, WACC, and other essential parameters.
- Real-Time Calculations: Automatic updates provide immediate insights as you adjust inputs.
- Professional-Grade Template: A polished Excel file crafted for high-quality valuation analysis.
- Customizable and Multi-Use: Designed for adaptability, making it ideal for ongoing detailed forecasts.
Core Features
- Customizable Forecast Inputs: Adjust essential factors such as revenue growth, EBITDA percentages, and capital expenditures.
- Instant DCF Valuation: Quickly computes intrinsic value, NPV, and various other financial metrics.
- High-Level Accuracy: Leverages MorningStar Partners, L.P.'s real-world financial data for precise valuation results.
- Streamlined Scenario Analysis: Effortlessly evaluate different assumptions and analyze outcomes side-by-side.
- Efficiency-Boosting Solution: Remove the complexity of building detailed valuation models from the ground up.
How It Operates
- Download: Get the pre-prepared Excel file containing MorningStar Partners, L.P. (TXO)'s financial data.
- Customize: Modify forecasts like revenue growth, EBITDA percentage, and WACC to fit your analysis.
- Automated Updates: The calculations for intrinsic value and NPV refresh instantly as you make changes.
- Scenario Testing: Generate various projections and analyze the results without delay.
- Informed Decisions: Leverage the valuation outcomes to enhance your investment approach.
Why Opt for MorningStar Partners, L.P. (TXO) Calculator?
- Time-Efficient: Skip the hassle of building a DCF model from the ground up – it’s immediately available for use.
- Enhanced Accuracy: Dependable financial information and calculations minimize valuation errors.
- Completely Customizable: Adjust the model to suit your assumptions and forecasts.
- Simple to Understand: Intuitive charts and outputs facilitate easy analysis of results.
- Endorsed by Professionals: Crafted for experts who prioritize both precision and usability.
Who Can Benefit from MorningStar Partners, L.P. (TXO)?
- Investors: Leverage our comprehensive analysis tools to make informed investment choices.
- Financial Analysts: Enhance your efficiency with our customizable financial models at your fingertips.
- Consultants: Effortlessly tailor our resources for impactful client presentations and reports.
- Finance Enthusiasts: Expand your knowledge of investment strategies and valuation methodologies through practical applications.
- Educators and Students: Utilize our offerings as a hands-on resource for finance education and real-world applications.
Components of the Template
- Pre-Filled Data: Features MorningStar Partners, L.P. (TXO)'s historical financial performance and projections.
- Discounted Cash Flow Model: An editable DCF valuation model complete with automated calculations.
- Weighted Average Cost of Capital (WACC): A specific sheet designed for calculating WACC using customized inputs.
- Key Financial Ratios: Evaluate MorningStar Partners, L.P. (TXO)'s profitability, efficiency, and leverage metrics.
- Customizable Inputs: Easily modify revenue growth, margins, and tax rates.
- Clear Dashboard: Visuals and tables that present essential valuation outcomes.
Disclaimer
All information, articles, and product details provided on this website are for general informational and educational purposes only. We do not claim any ownership over, nor do we intend to infringe upon, any trademarks, copyrights, logos, brand names, or other intellectual property mentioned or depicted on this site. Such intellectual property remains the property of its respective owners, and any references here are made solely for identification or informational purposes, without implying any affiliation, endorsement, or partnership.
We make no representations or warranties, express or implied, regarding the accuracy, completeness, or suitability of any content or products presented. Nothing on this website should be construed as legal, tax, investment, financial, medical, or other professional advice. In addition, no part of this site—including articles or product references—constitutes a solicitation, recommendation, endorsement, advertisement, or offer to buy or sell any securities, franchises, or other financial instruments, particularly in jurisdictions where such activity would be unlawful.
All content is of a general nature and may not address the specific circumstances of any individual or entity. It is not a substitute for professional advice or services. Any actions you take based on the information provided here are strictly at your own risk. You accept full responsibility for any decisions or outcomes arising from your use of this website and agree to release us from any liability in connection with your use of, or reliance upon, the content or products found herein.