
|
Ubisoft Entertainment SA (UBI.PA) DCF -Bewertung |
Fully Editable: Tailor To Your Needs In Excel Or Sheets
Professional Design: Trusted, Industry-Standard Templates
Investor-Approved Valuation Models
MAC/PC Compatible, Fully Unlocked
No Expertise Is Needed; Easy To Follow
Ubisoft Entertainment SA (UBI.PA) Bundle
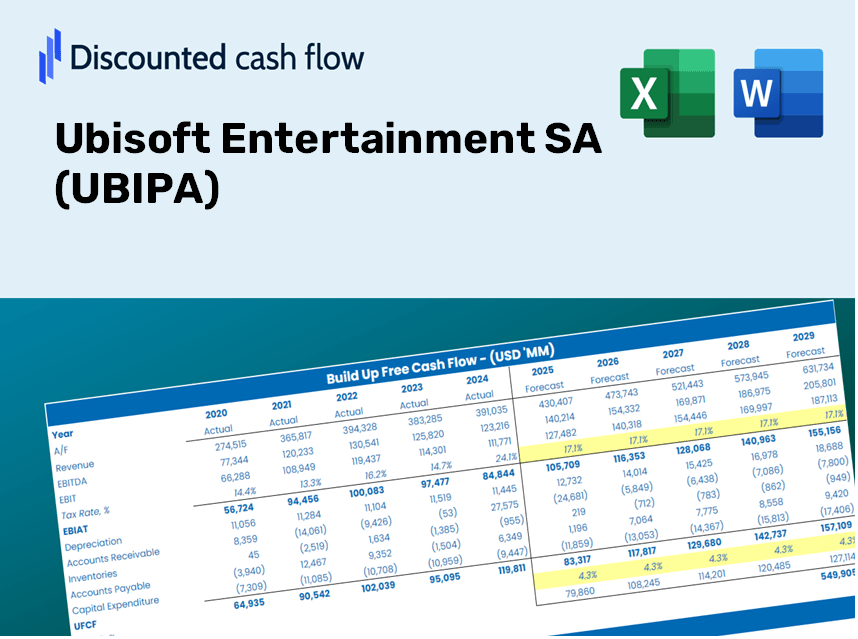
Verbessern Sie Ihre Anlagestrategien mit dem Ubisoft Entertainment SA (UBIPA) DCF -Taschenrechner! Erforschen Sie authentische Ubisoft -Finanzdaten, passen Sie Wachstumsprognosen und -kosten an und beachten Sie sofort, wie sich diese Modifikationen auf den inneren Wert von Ubisoft auswirken.
What You Will Receive
- Adjustable Forecast Inputs: Effortlessly modify parameters (growth %, margins, WACC) to develop various scenarios.
- Comprehensive Data: Ubisoft's financial data pre-loaded to facilitate your analysis.
- Instant DCF Results: The template automatically computes Net Present Value (NPV) and intrinsic value for your convenience.
- Tailored and Professional: A sleek Excel model that can be customized to fit your valuation requirements.
- Designed for Analysts and Investors: Perfect for testing forecasts, confirming strategies, and enhancing efficiency.
Key Features
- Pre-Loaded Data: Ubisoft Entertainment SA’s historical financial statements and pre-filled forecasts.
- Fully Adjustable Inputs: Customize WACC, tax rates, revenue growth, and EBITDA margins.
- Instant Results: Watch Ubisoft’s intrinsic value recalculate in real time.
- Clear Visual Outputs: Dashboard charts present valuation results and key metrics.
- Built for Accuracy: A professional tool tailored for analysts, investors, and finance professionals.
How It Functions
- Download: Obtain the pre-prepared Excel file containing Ubisoft Entertainment SA (UBIPA)'s financial data.
- Customize: Modify your forecasts, including revenue growth, EBITDA %, and WACC settings.
- Update Automatically: Enjoy real-time updates for intrinsic value and NPV calculations.
- Test Scenarios: Generate various projections and quickly analyze different outcomes.
- Make Decisions: Leverage valuation results to inform your investment choices.
Why Opt for This Calculator for Ubisoft Entertainment (UBIPA)?
- Accuracy: Utilizes real Ubisoft financial data for precise calculations.
- Flexibility: Empowering users to experiment with and adjust inputs effortlessly.
- Time-Saving: Avoid the complexities of creating a DCF model from the ground up.
- Professional-Grade: Crafted with the expertise and usability expectations of CFOs.
- User-Friendly: Intuitive design suitable for all user levels, including those without advanced financial modeling skills.
Who Can Benefit from This Product?
- Investors: Effectively assess Ubisoft’s fair value before making investment choices.
- CFOs: Utilize a professional-grade DCF model for enhanced financial reporting and analytics.
- Consultants: Easily customize the template for client valuation reports.
- Entrepreneurs: Discover financial modeling techniques employed by leading gaming companies.
- Educators: Incorporate it as a teaching resource to illustrate valuation methods.
Contents of the Template
- Pre-Filled DCF Model: Ubisoft Entertainment SA’s financial data preloaded for immediate analysis.
- WACC Calculator: Comprehensive calculations for the Weighted Average Cost of Capital.
- Financial Ratios: Assess Ubisoft’s profitability, leverage, and operational efficiency.
- Editable Inputs: Customize variables such as growth rates, margins, and CAPEX to suit your projections.
- Financial Statements: Access annual and quarterly reports for in-depth analysis.
- Interactive Dashboard: Effortlessly visualize essential valuation metrics and outcomes.
Disclaimer
All information, articles, and product details provided on this website are for general informational and educational purposes only. We do not claim any ownership over, nor do we intend to infringe upon, any trademarks, copyrights, logos, brand names, or other intellectual property mentioned or depicted on this site. Such intellectual property remains the property of its respective owners, and any references here are made solely for identification or informational purposes, without implying any affiliation, endorsement, or partnership.
We make no representations or warranties, express or implied, regarding the accuracy, completeness, or suitability of any content or products presented. Nothing on this website should be construed as legal, tax, investment, financial, medical, or other professional advice. In addition, no part of this site—including articles or product references—constitutes a solicitation, recommendation, endorsement, advertisement, or offer to buy or sell any securities, franchises, or other financial instruments, particularly in jurisdictions where such activity would be unlawful.
All content is of a general nature and may not address the specific circumstances of any individual or entity. It is not a substitute for professional advice or services. Any actions you take based on the information provided here are strictly at your own risk. You accept full responsibility for any decisions or outcomes arising from your use of this website and agree to release us from any liability in connection with your use of, or reliance upon, the content or products found herein.