
|
Ultra Clean Holdings, Inc. (UCTT) DCF -Bewertung |
Fully Editable: Tailor To Your Needs In Excel Or Sheets
Professional Design: Trusted, Industry-Standard Templates
Investor-Approved Valuation Models
MAC/PC Compatible, Fully Unlocked
No Expertise Is Needed; Easy To Follow
Ultra Clean Holdings, Inc. (UCTT) Bundle
Möchten Sie den inneren Wert von Ultra Clean Holdings, Inc. bewerten? Unser (UCTT) DCF-Taschenrechner integriert reale Daten mit umfassenden Anpassungsfunktionen, sodass Sie Ihre Prognosen verfeinern und Ihre Anlagestrategien verbessern können.
What You Will Get
- Editable Forecast Inputs: Easily modify assumptions (growth %, margins, WACC) to create various scenarios.
- Real-World Data: Ultra Clean Holdings, Inc.'s (UCTT) financial data pre-filled to kickstart your analysis.
- Automatic DCF Outputs: The template computes Net Present Value (NPV) and intrinsic value automatically.
- Customizable and Professional: A refined Excel model that adjusts to your valuation requirements.
- Built for Analysts and Investors: Perfect for testing projections, validating strategies, and enhancing efficiency.
Key Features
- Real-Life UCTT Data: Pre-filled with Ultra Clean Holdings' historical financials and future projections.
- Fully Customizable Inputs: Modify revenue growth, profit margins, WACC, tax rates, and capital expenditures to suit your analysis.
- Dynamic Valuation Model: Automatic recalculations of Net Present Value (NPV) and intrinsic value based on your adjustments.
- Scenario Testing: Generate multiple forecasting scenarios to evaluate various valuation outcomes.
- User-Friendly Design: Intuitive layout, crafted for both professionals and newcomers in the field.
How It Works
- Step 1: Download the Excel file for Ultra Clean Holdings, Inc. (UCTT).
- Step 2: Review UCTT's pre-filled financial data and projections.
- Step 3: Adjust key inputs such as revenue growth, WACC, and tax rates (highlighted cells).
- Step 4: Observe the DCF model update in real-time as you modify assumptions.
- Step 5: Evaluate the outputs and utilize the findings for your investment decisions.
Why Choose This Calculator for Ultra Clean Holdings, Inc. (UCTT)?
- Comprehensive Tool: Features DCF, WACC, and financial ratio analyses tailored for UCTT.
- Customizable Inputs: Modify yellow-highlighted cells to explore different financial scenarios for UCTT.
- Detailed Insights: Automatically computes Ultra Clean’s intrinsic value and Net Present Value.
- Preloaded Data: Historical and projected data provide reliable starting points for analysis.
- Professional Quality: Perfect for financial analysts, investors, and business consultants focusing on UCTT.
Who Should Use This Product?
- Professional Investors: Develop comprehensive and accurate valuation models for analyzing UCTT's portfolio.
- Corporate Finance Teams: Evaluate valuation scenarios to inform strategic decisions within the company.
- Consultants and Advisors: Deliver precise valuation insights to clients considering investments in Ultra Clean Holdings (UCTT).
- Students and Educators: Utilize real-world data to enhance learning and practice in financial modeling related to UCTT.
- Tech Enthusiasts: Gain insights into how companies like Ultra Clean Holdings (UCTT) are valued in the tech market.
What the Template Contains
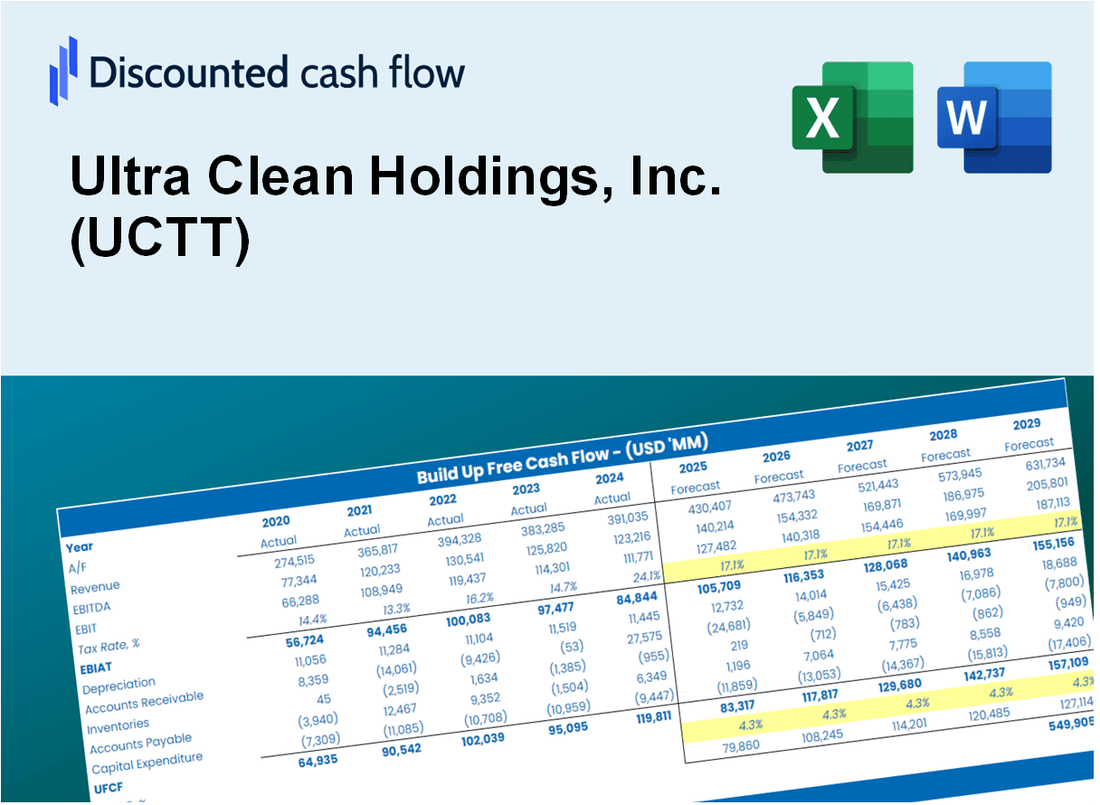
- Preloaded UCTT Data: Historical and projected financial data, including revenue, EBIT, and capital expenditures.
- DCF and WACC Models: Professional-grade sheets for calculating intrinsic value and Weighted Average Cost of Capital.
- Editable Inputs: Yellow-highlighted cells for adjusting revenue growth, tax rates, and discount rates.
- Financial Statements: Comprehensive annual and quarterly financials for deeper analysis.
- Key Ratios: Profitability, leverage, and efficiency ratios to evaluate performance.
- Dashboard and Charts: Visual summaries of valuation outcomes and assumptions.
Disclaimer
All information, articles, and product details provided on this website are for general informational and educational purposes only. We do not claim any ownership over, nor do we intend to infringe upon, any trademarks, copyrights, logos, brand names, or other intellectual property mentioned or depicted on this site. Such intellectual property remains the property of its respective owners, and any references here are made solely for identification or informational purposes, without implying any affiliation, endorsement, or partnership.
We make no representations or warranties, express or implied, regarding the accuracy, completeness, or suitability of any content or products presented. Nothing on this website should be construed as legal, tax, investment, financial, medical, or other professional advice. In addition, no part of this site—including articles or product references—constitutes a solicitation, recommendation, endorsement, advertisement, or offer to buy or sell any securities, franchises, or other financial instruments, particularly in jurisdictions where such activity would be unlawful.
All content is of a general nature and may not address the specific circumstances of any individual or entity. It is not a substitute for professional advice or services. Any actions you take based on the information provided here are strictly at your own risk. You accept full responsibility for any decisions or outcomes arising from your use of this website and agree to release us from any liability in connection with your use of, or reliance upon, the content or products found herein.